About the App Customization
You must be authenticated with the Organization administrator role.
You can create your own dashboards and alerts by following the Grafana documentation on creating dashboards and alerts. The steps of the task do not change but here is some specific information about Saagie.
Administration
The default user account is admin, and is required to edit data sources, create dashboards and alerts, add contact points, etc. Its credentials can be changed with the following environment variables:
-
GF_SECURITY_ADMIN_USER -
GF_SECURITY_ADMIN_PASSWORD
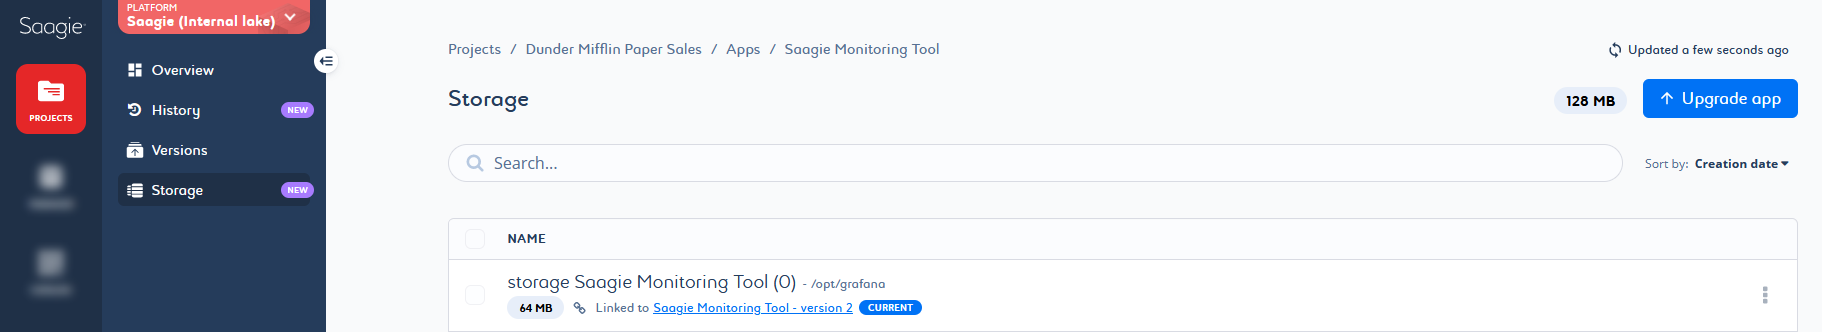
Storage
When installing an app from the Saagie catalog, the storage space is created and attached by default. Installing Saagie Usage Monitoring creates the /opt/grafana storage space by default. Alerts and dashboards are saved under this storage space, making them persistent.
Dashboards
Saagie Usage Monitoring comes with default dashboards. For more information, see Saagie Usage Monitoring Default Dashboards.
Dashboards are based on a data source defined in Grafana. For more information, see the Grafana documentation on Data source management.
Alerts
Grafana alerts inform you of problems in your systems moments after they occur.
SMTP-Based Alert Notifications
By default, alerts are sent via emails. For this to work, you must have an SMTP server that will receive these alerts. Enabling SMTP alerts requires setting the following environment variables:
-
GF_SMTP_ENABLED: Enables SMTP alerts
→ The default value isfalse. -
GF_SMTP_HOST: SMTP host and port -
GF_SMTP_USER: SMTP user -
GF_SMTP_PASSWORD: SMTP password -
GF_SMTP_FROM_ADDRESS: Email address of the alert sender -
GF_SMTP_SKIP_VERIFY: Skips SSL for SMTP server
→ The default value isfalse.
| You can set up other alert modes by configuring contact points. |
Default Alert Rules
Saagie Usage Monitoring comes with the following default alert rules:
-
HDFS usage sample: Warns you when the size of the storage space exceeds the defined occupancy rate.
→ The default value is70%. -
Job exceeded time: Warns you when the job execution time exceeds the defined execution time, which is calculated by the formula Q3+1,5*(Q3-Q1).
→ By default, it looks at data from the last week and the last 10 executed jobs.Data is retrieved if there are at least 20 executed jobs. -
Jobs and apps count: Warns you when the amount of jobs and apps exceeds the defined threshold.
→ The default value is100.
SELECT
  $__time(snapshot_date),
  sum(job_count) as "job_count"
FROM supervision_saagie_jobs_snapshot
WHERE $__timeFilter(snapshot_date)
GROUP BY 1
Cron
You can customize the frequency of data retrieval using the SAAGIE_SUM_CRON environment variable. Create the SAAGIE_SUM_CRON environment variable in your project with your value in cron format. By default, Cron will run a Python job on an hourly basis to synchronise the data.