About Saagie Resources Monitoring
SRM gives you an overview of your cluster’s resource consumption through a series of graphs. It is based on Grafana. The custom dashboard lets you quickly visualize and analyze RAM and CPU consumption.
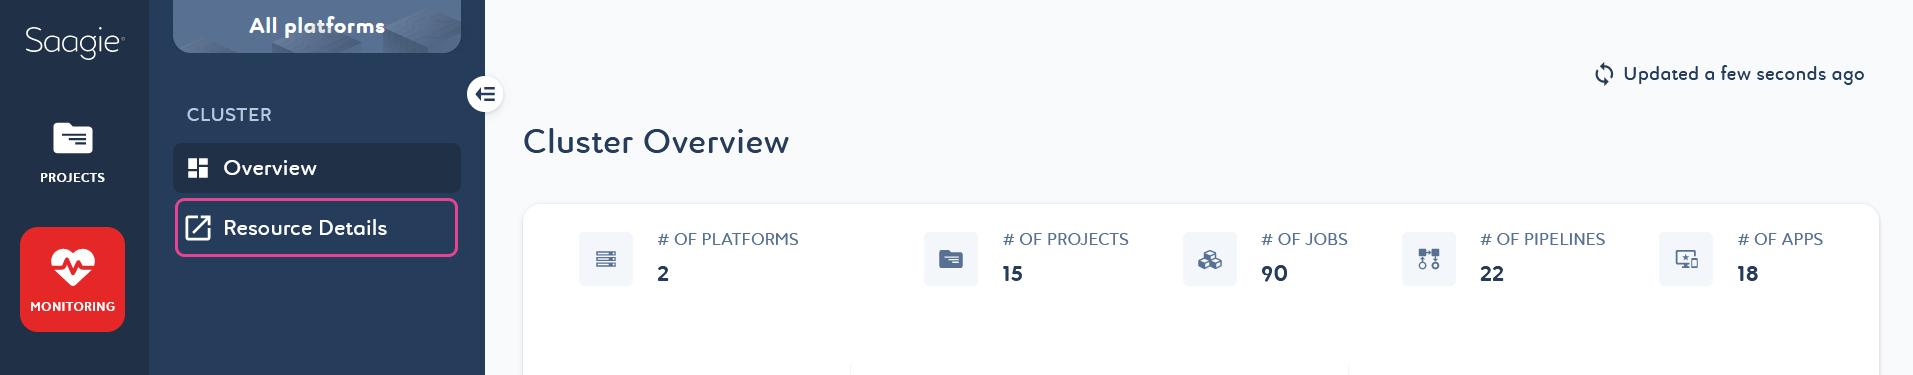
To access SRM, click ![]() Resource Details in the secondary navigation menu of the
Resource Details in the secondary navigation menu of the ![]() Monitoring module. It will open SRM in a new tab.
Monitoring module. It will open SRM in a new tab.
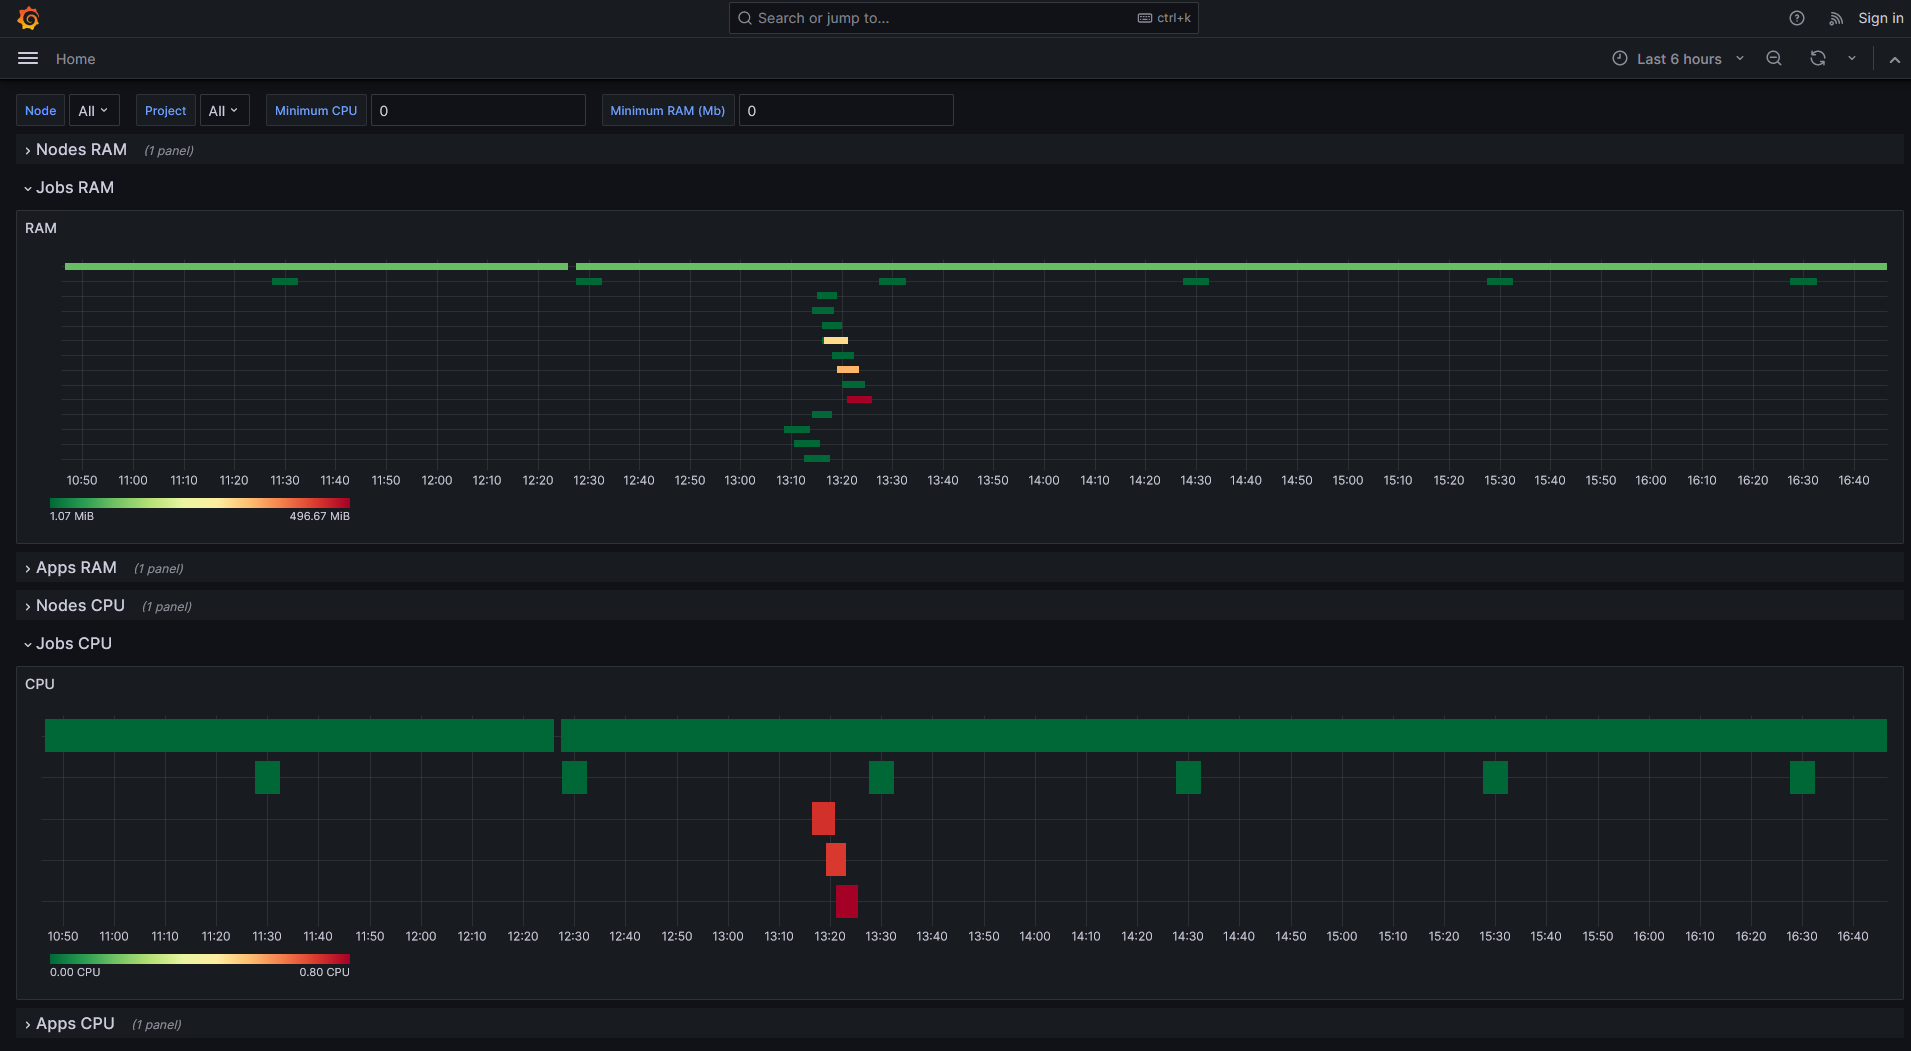
The SRM Dashboard
SRM dashboard is simply organized. It is composed of multiple rows that are collapsed by default. You can see the consumption of nodes, jobs and apps through CPU graphs and RAM graphs. You can also see the consumption of each pod of the lakehouse. There is a dedicated row for each.
|
Use filters to view your graphs with more relevant data. There are four custom filters. A filter to select the specific node(s) to be displayed, one for the project(s), and two to define minimum CPU and RAM consumption.
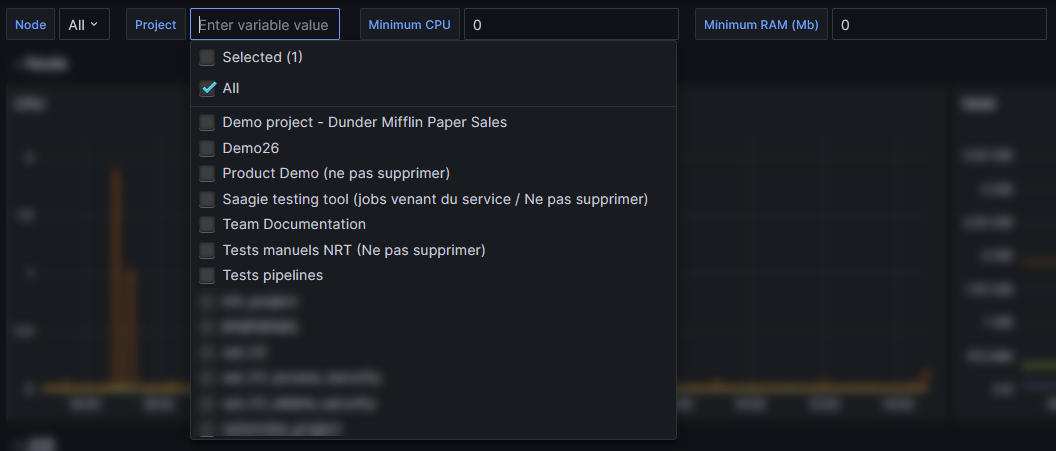
Click the filter and select one or more values from the list, or enter the desired value in the field provided. The graphics will be updated accordingly. This may take some time. You can see two arrows rotating at the top right of each graph as they update.
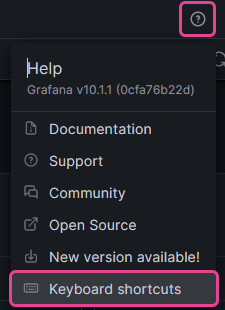
You can click the question mark at the top right of the page for a summary of keyboard shortcuts.
For more information on how to use dashboards, see the Grafana documentation, Use dashboards.