Saagie Usage Monitoring Default Dashboards
When installing SUM, you must set several environment variables, including the MONITORING_OPT environment variable. This variable allows you to choose the default configuration of your dashboards by choosing between the following values:
-
SAAGIE: Choose this value if you want to monitor only Saagie jobs, apps, and pipelines. This is the default value. -
SAAGIE_AND_DATALAKE: Choose this value if you want to monitor Saagie jobs, apps, and pipelines, as well as your HDFS data lake. -
SAAGIE_AND_S3: Choose this value if you want to monitor Saagie jobs, apps, and pipelines, as well as your S3 buckets.
If you choose the SAAGIE option, you will have the following three dashboards:
If you choose the SAAGIE_AND_DATALAKE option, you will have the dashboards included with the SAAGIE option, and additional dashboards with information about your HDFS storage space.
If you choose the SAAGIE_AND_S3 option, you will have the dashboards included with the SAAGIE option, and an additional dashboard with information about your S3 storage space.
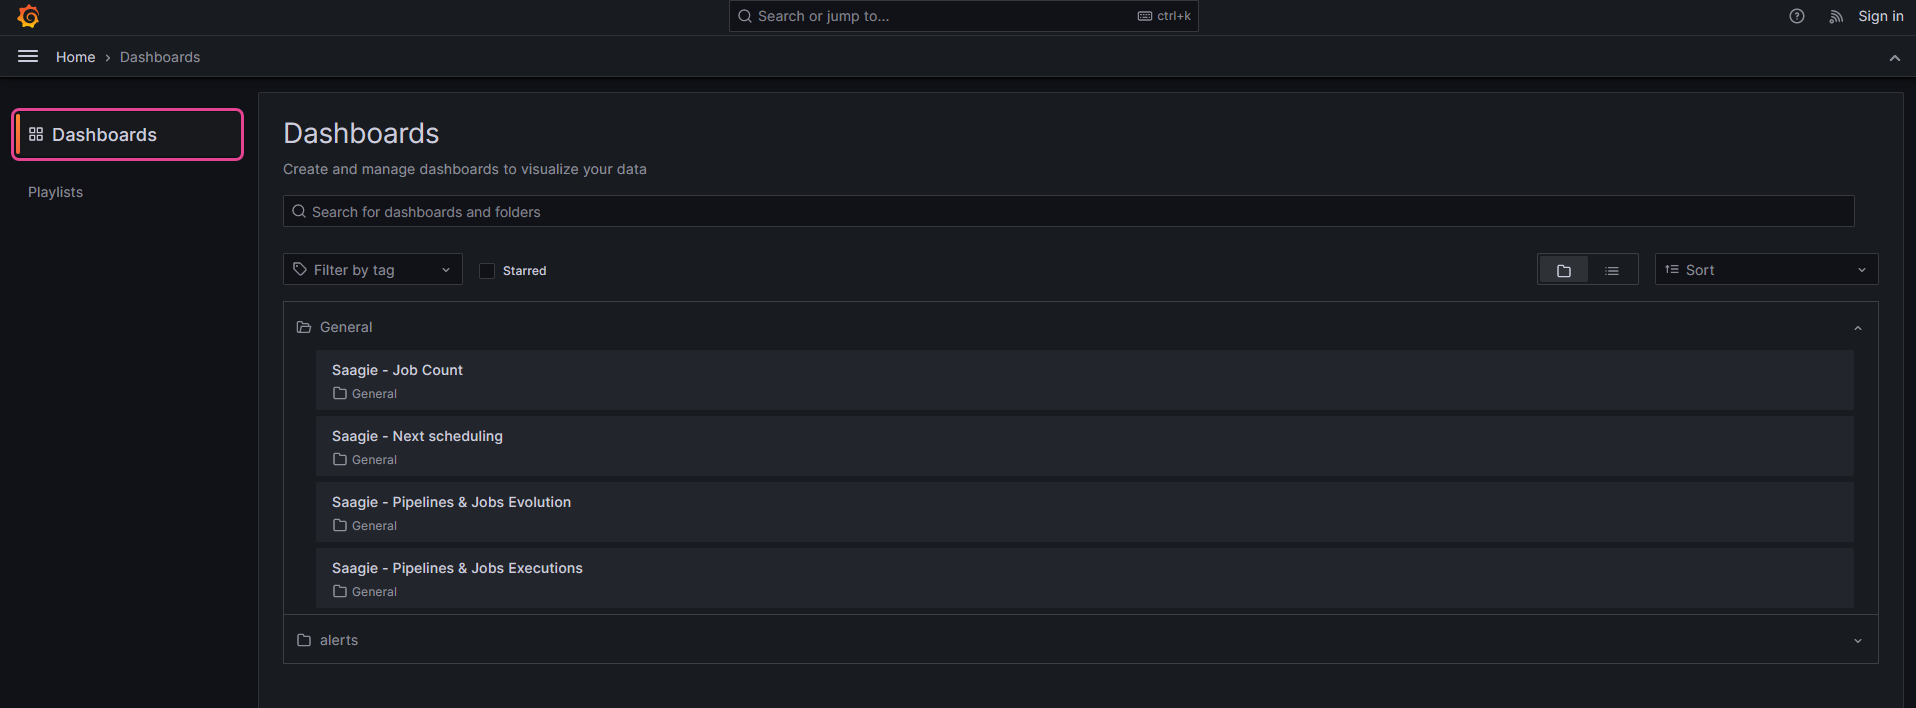
Dashboards are accessible from the Dashboards tab. Click the burger menu ![]() Dashboards.
Dashboards.
Saagie – Job Count
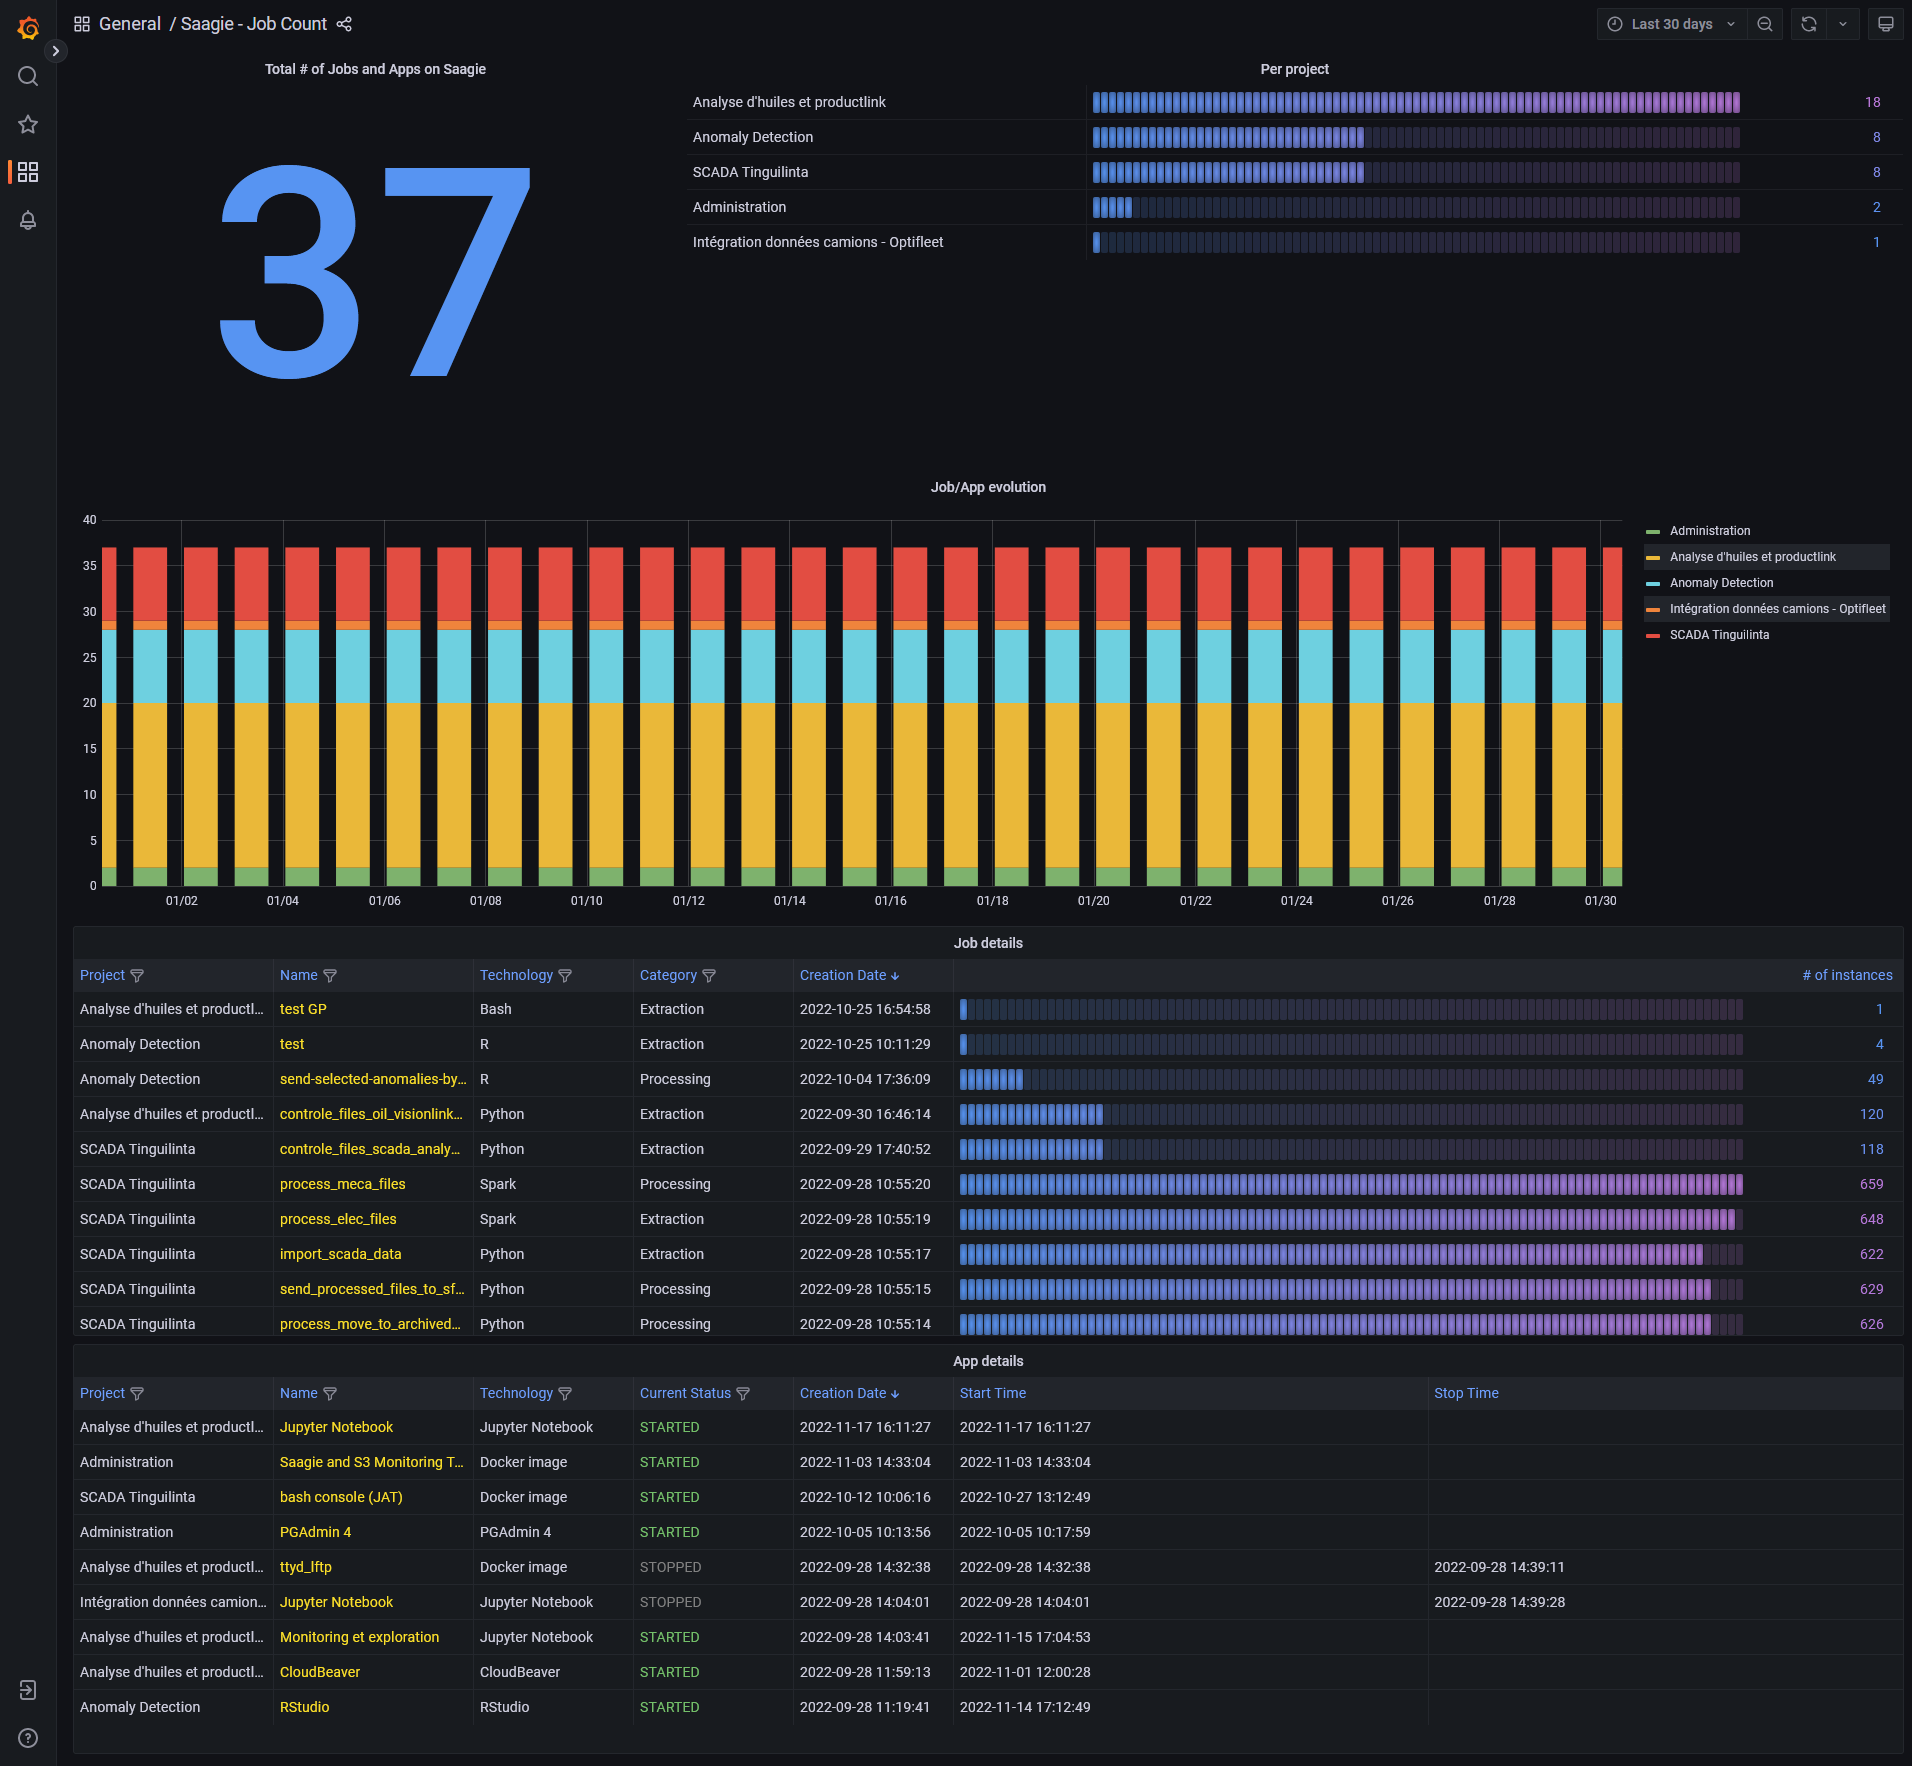
You can see information on the total number of jobs and apps on your Saagie platforms, their distribution and evolution in number per project, and details for each app and job.
| Click a legend item of a graph to display only the corresponding information. You can also view multiple items at once by pressing ctrl and clicking the desired legend items. To reset the graph, click a legend item twice. |
Saagie – Next Scheduling
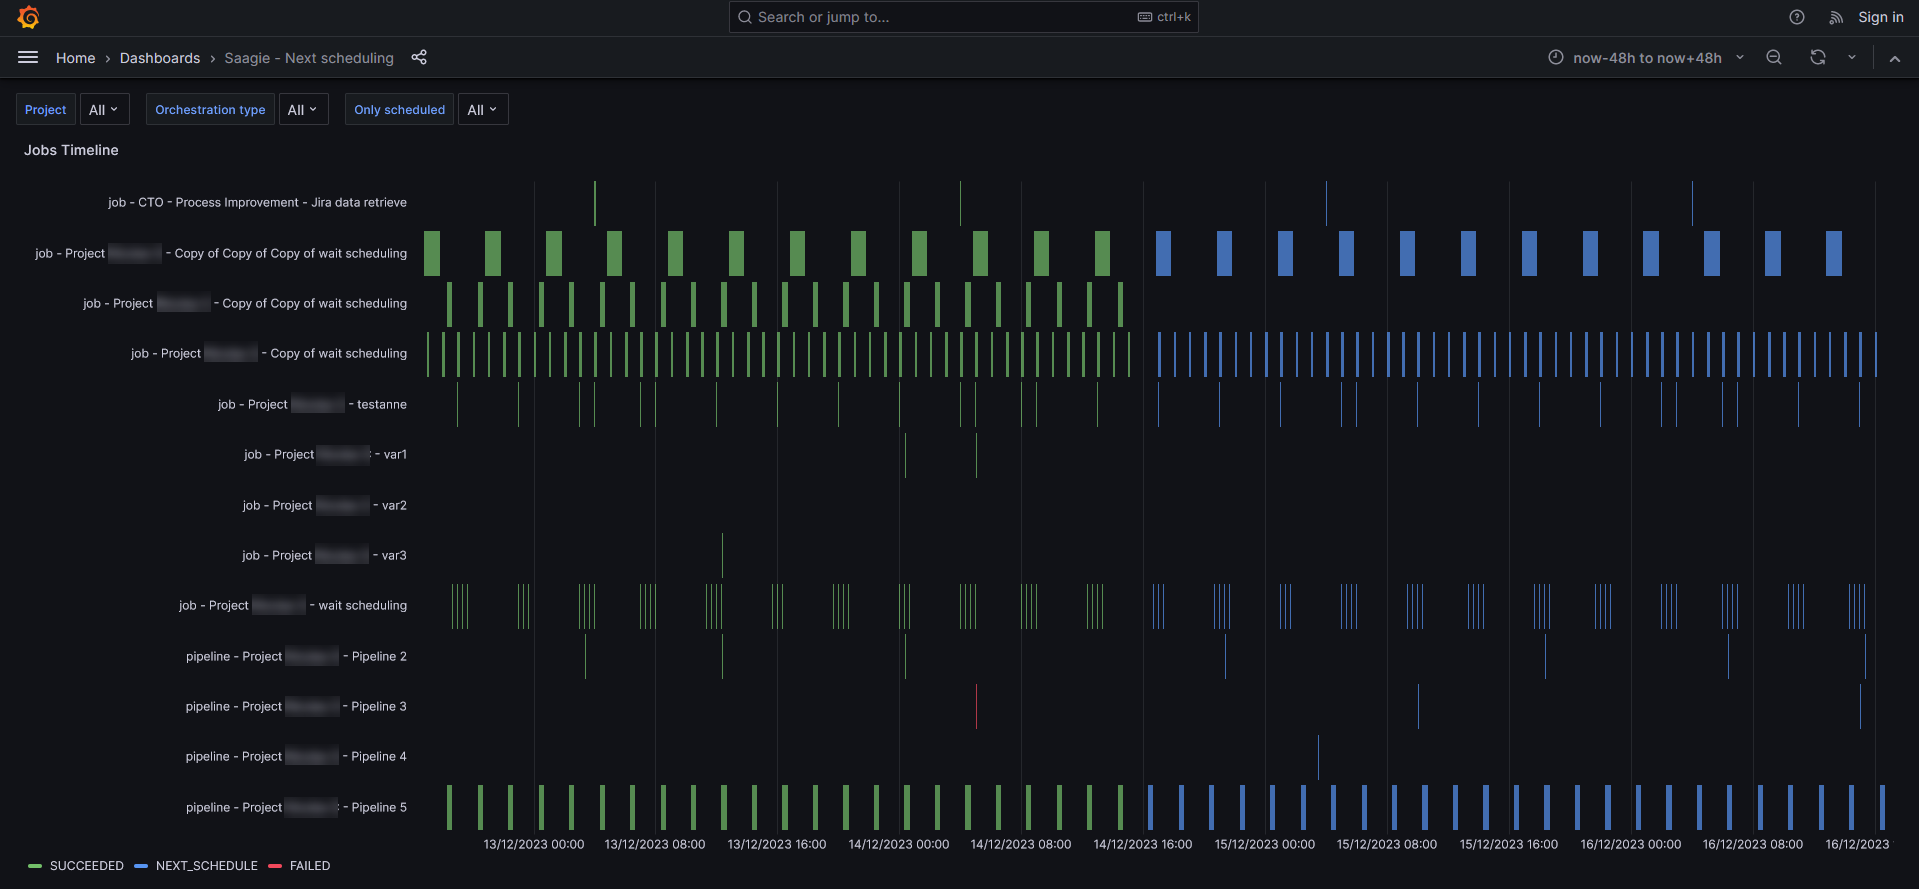
You can view information about the jobs and pipelines that have been completed, as well as the schedule for the upcoming jobs and pipelines.
Runtimes for upcoming jobs and pipelines are calculated on the basis of the average duration for previous jobs and pipelines, up to one month in advance. Note that the planning of upcoming jobs and pipelines is only displayed for pipelines and jobs already scheduled in Saagie. Schedules for items planned with an external scheduler are not displayed here.
Use the filters to display one or more specific projects, only jobs or pipelines, and only scheduled jobs and pipelines.
| Hover over an element in the graphs to display a tooltip with more details. Click the element to keep the tooltip open. Click the element again or anywhere else in the graph to close it. |
Saagie – Pipelines & Jobs Evolution
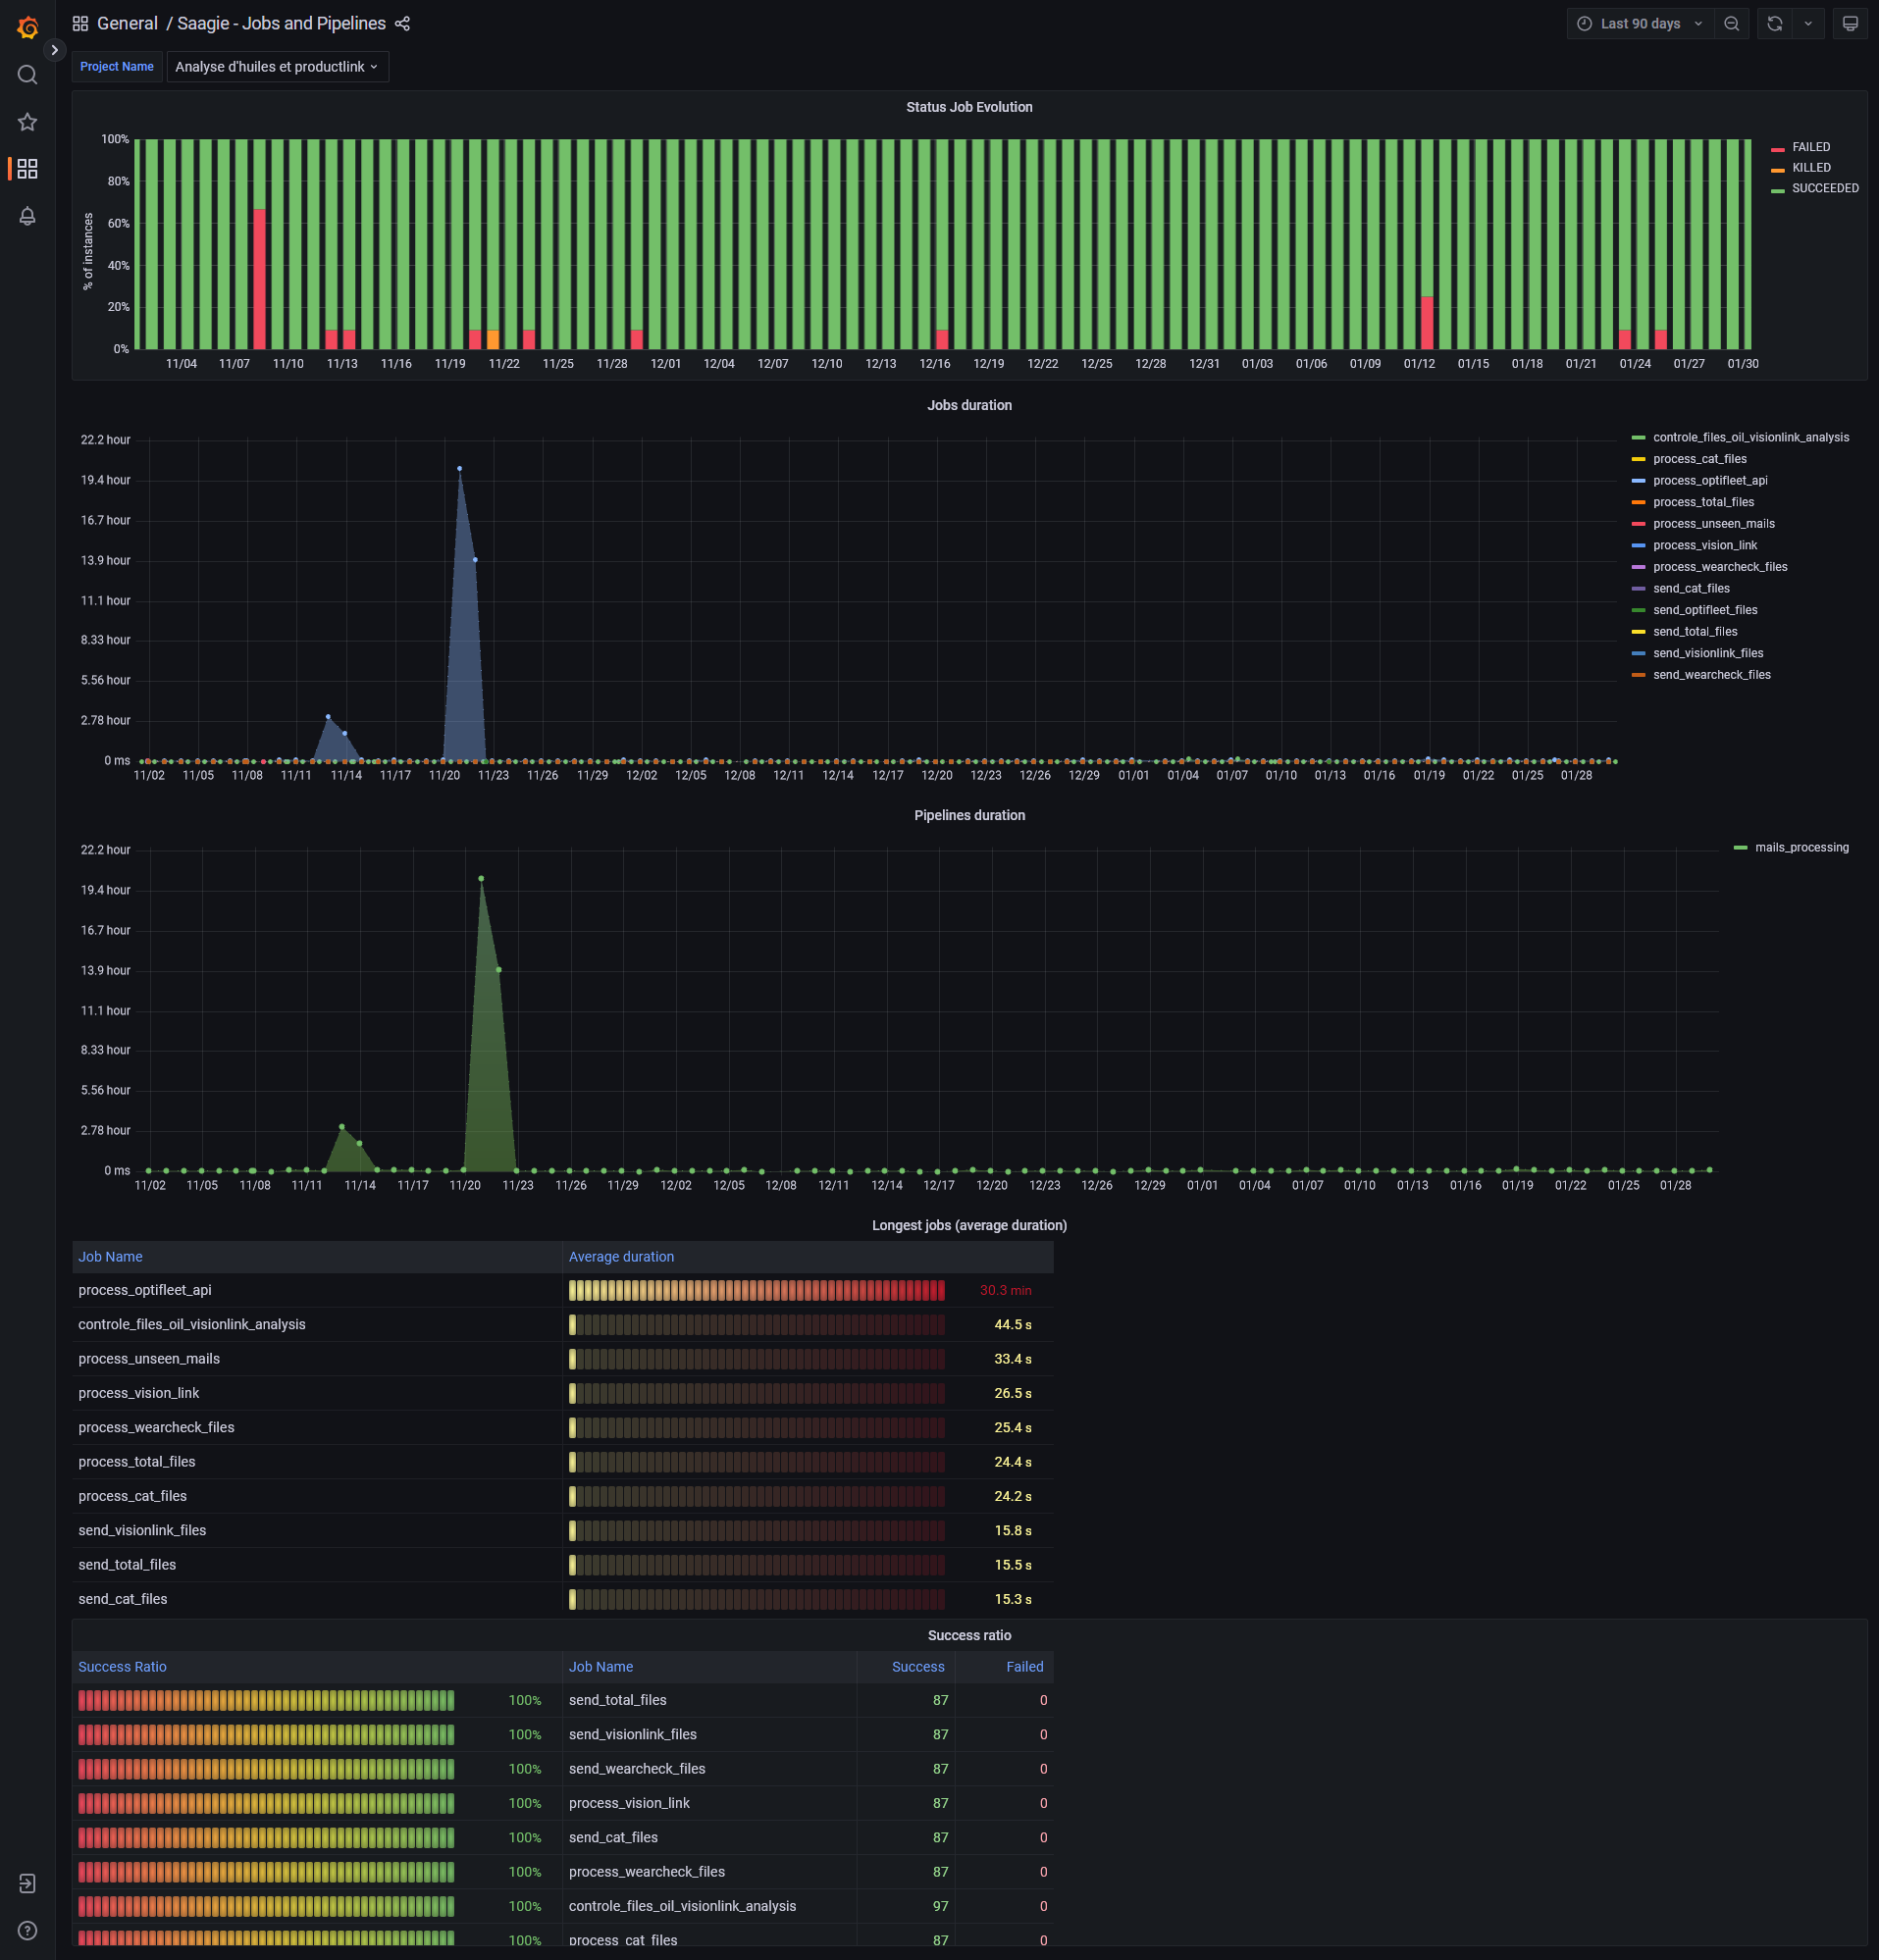
You can see information on the evolution of job status, the jobs and pipelines execution time, the average execution time for each job and its success rate.
|
Saagie – Jobs & Pipelines Execution
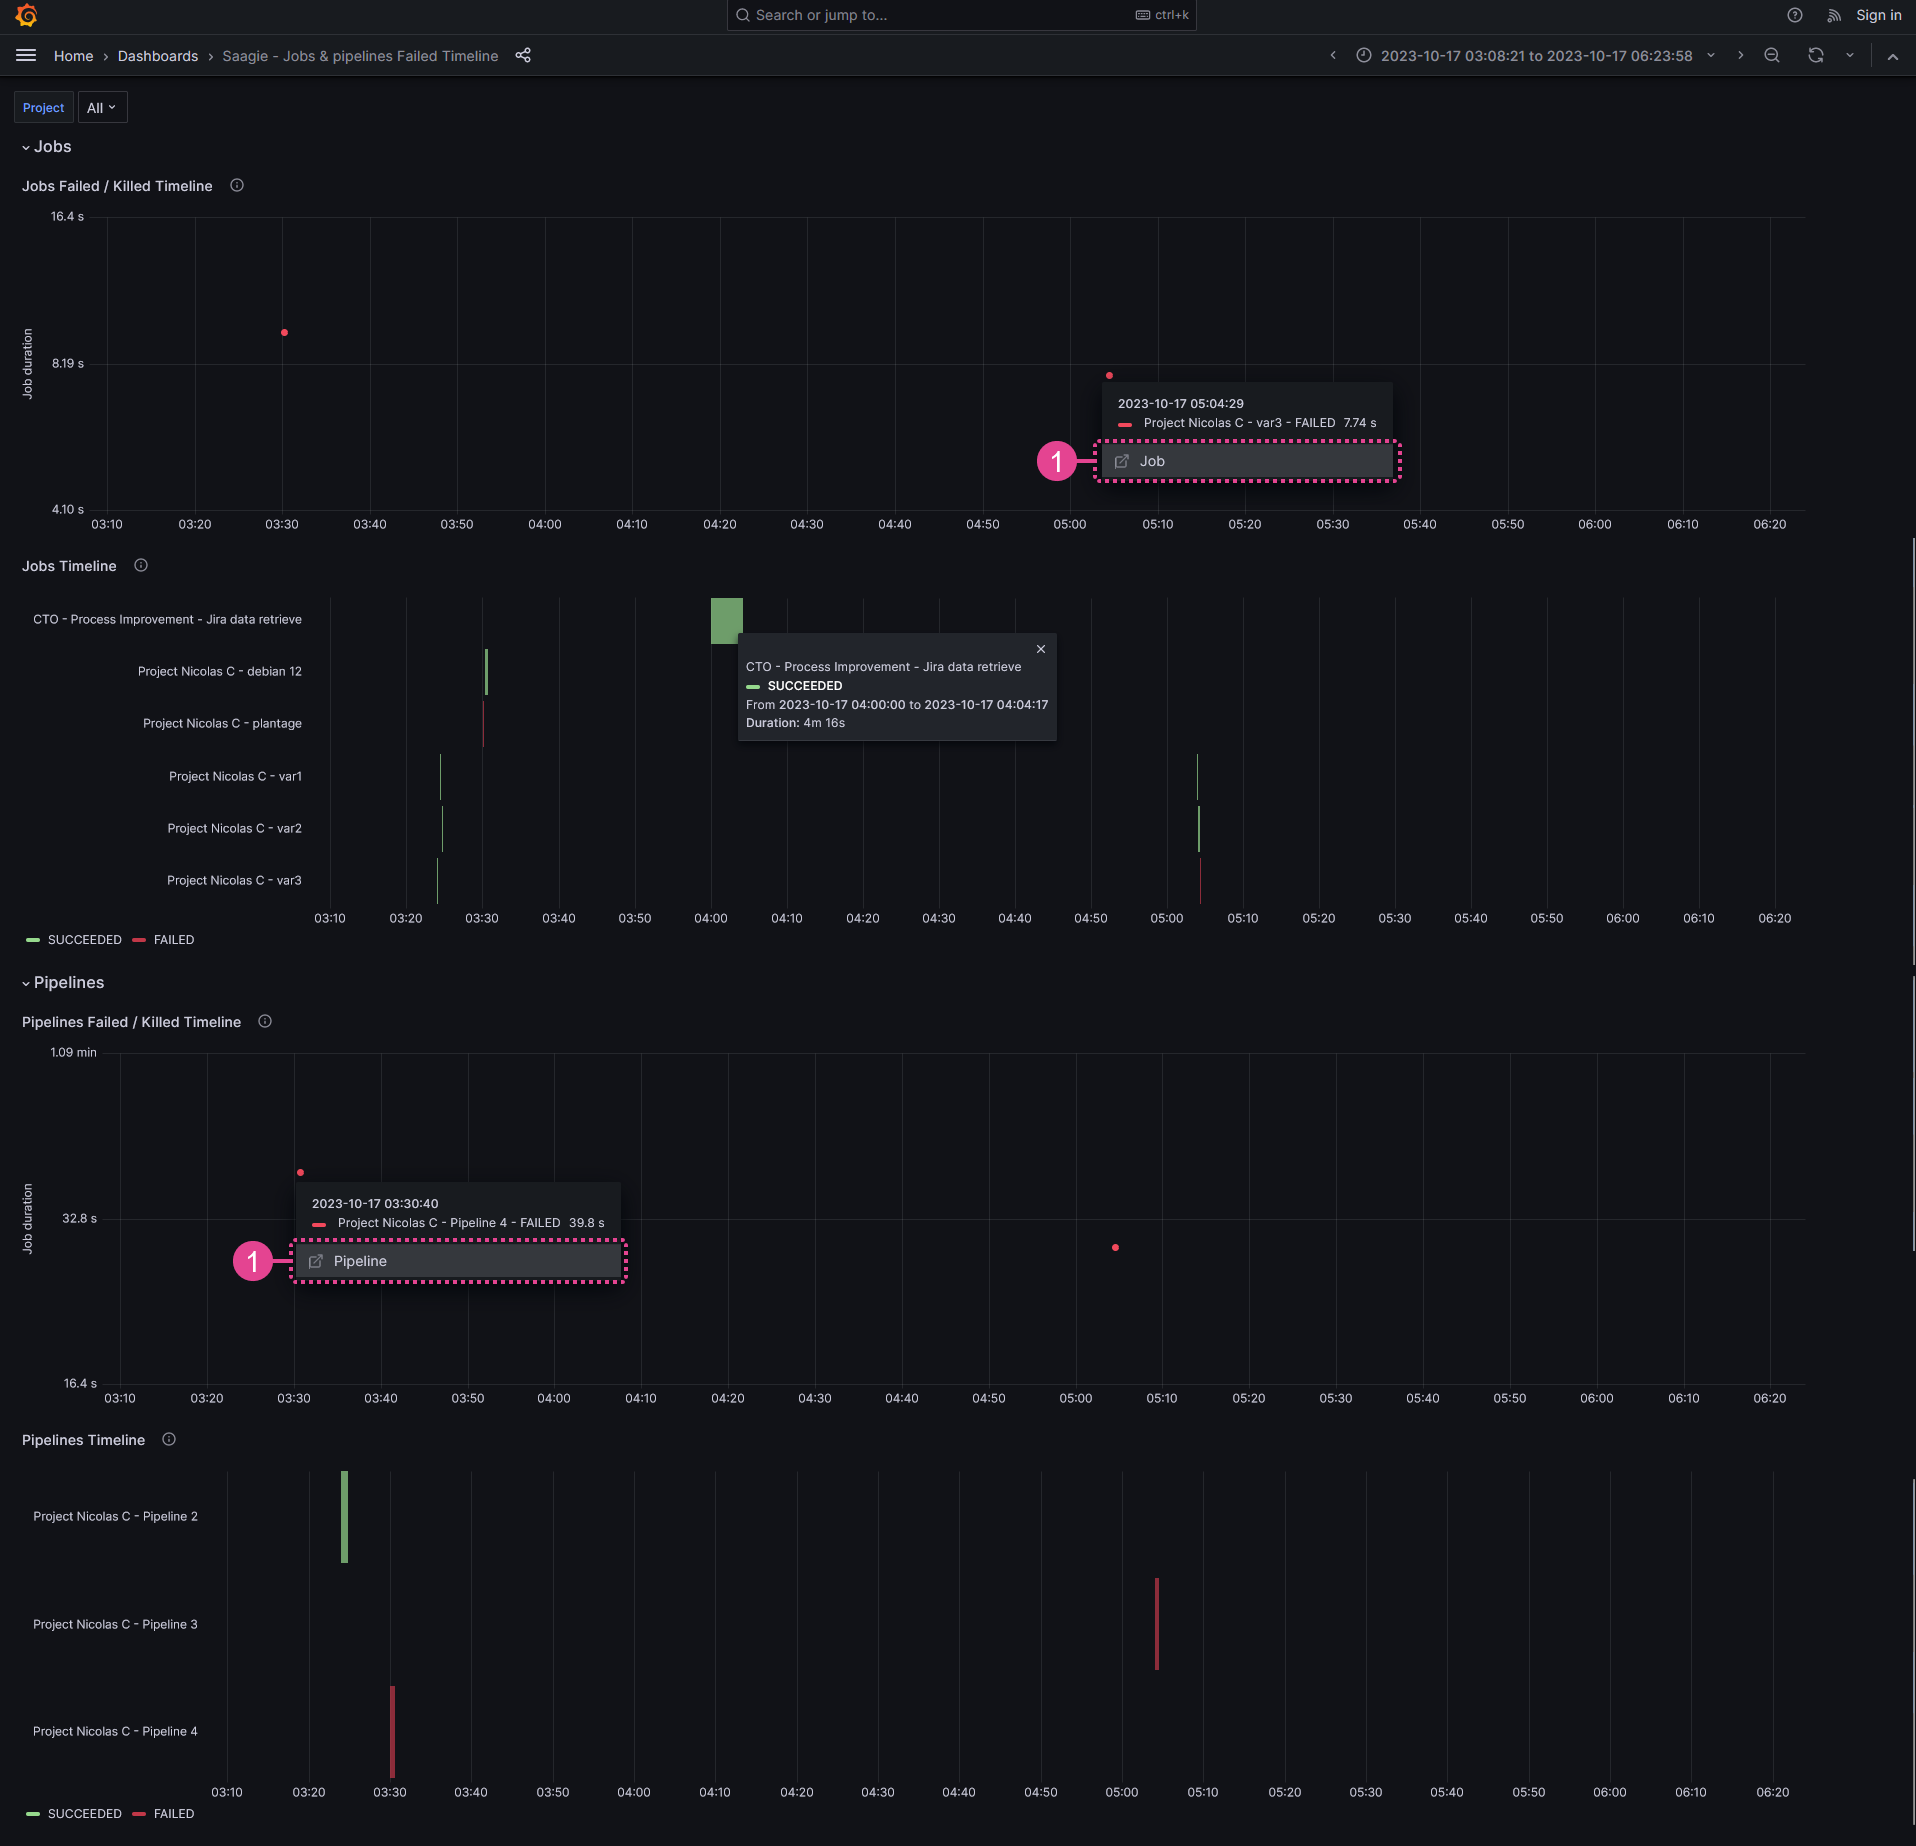
This dashboard consists of two sections, each with two graphs. There is a section for jobs and another for pipelines. Each section includes a graph showing a timeline of failed and killed jobs or pipelines, and another graph showing the overall timeline of jobs or pipelines.
Click or hover over an element in the graphs to display a tooltip with more details about a job or pipeline. You can see the job or pipeline name, date, failed or killed instance, status, and runtime.
In the Jobs Failed/Killed Timeline and Pipelines Failed/Killed Timeline graphs, when clicking a job or pipeline instance, a detailed tooltip is displayed. You can click ![]() Job or
Job or ![]() Pipeline (1) to open the instance of the job or pipeline in Saagie.
Pipeline (1) to open the instance of the job or pipeline in Saagie.
| Red dots are for failed jobs or pipelines and yellow dots are for killed jobs or pipelines. |
S3 – Global Usage
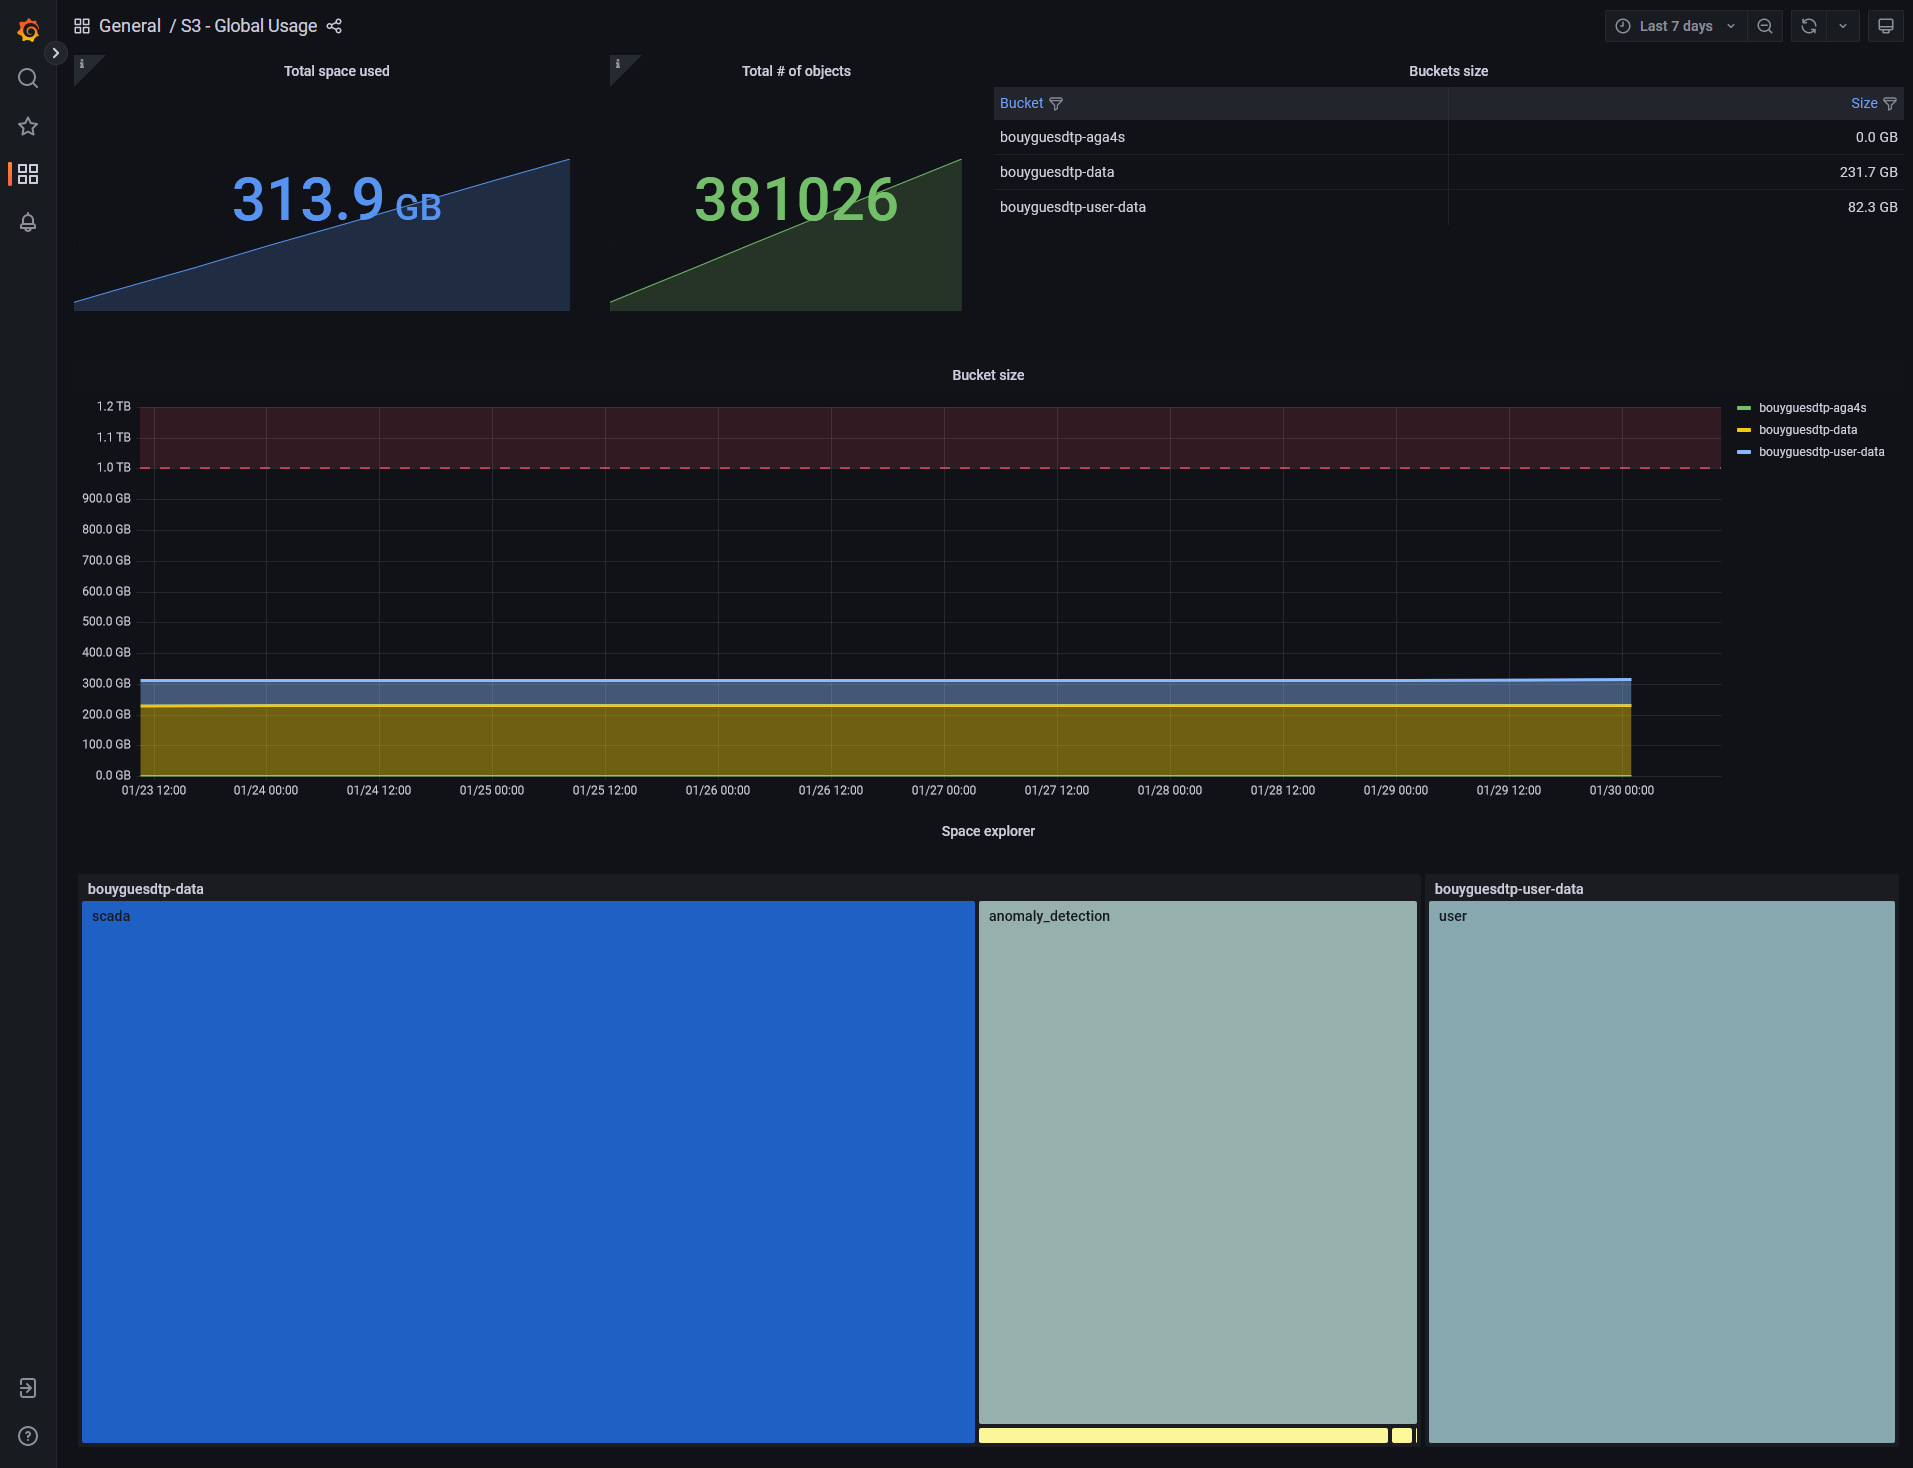
You can see information about the total space used by all your S3 buckets, their total number of objects and the size of each bucket. The size of your S3 buckets is presented through a table and a graph.
Data Lake - Disk Space Explorer
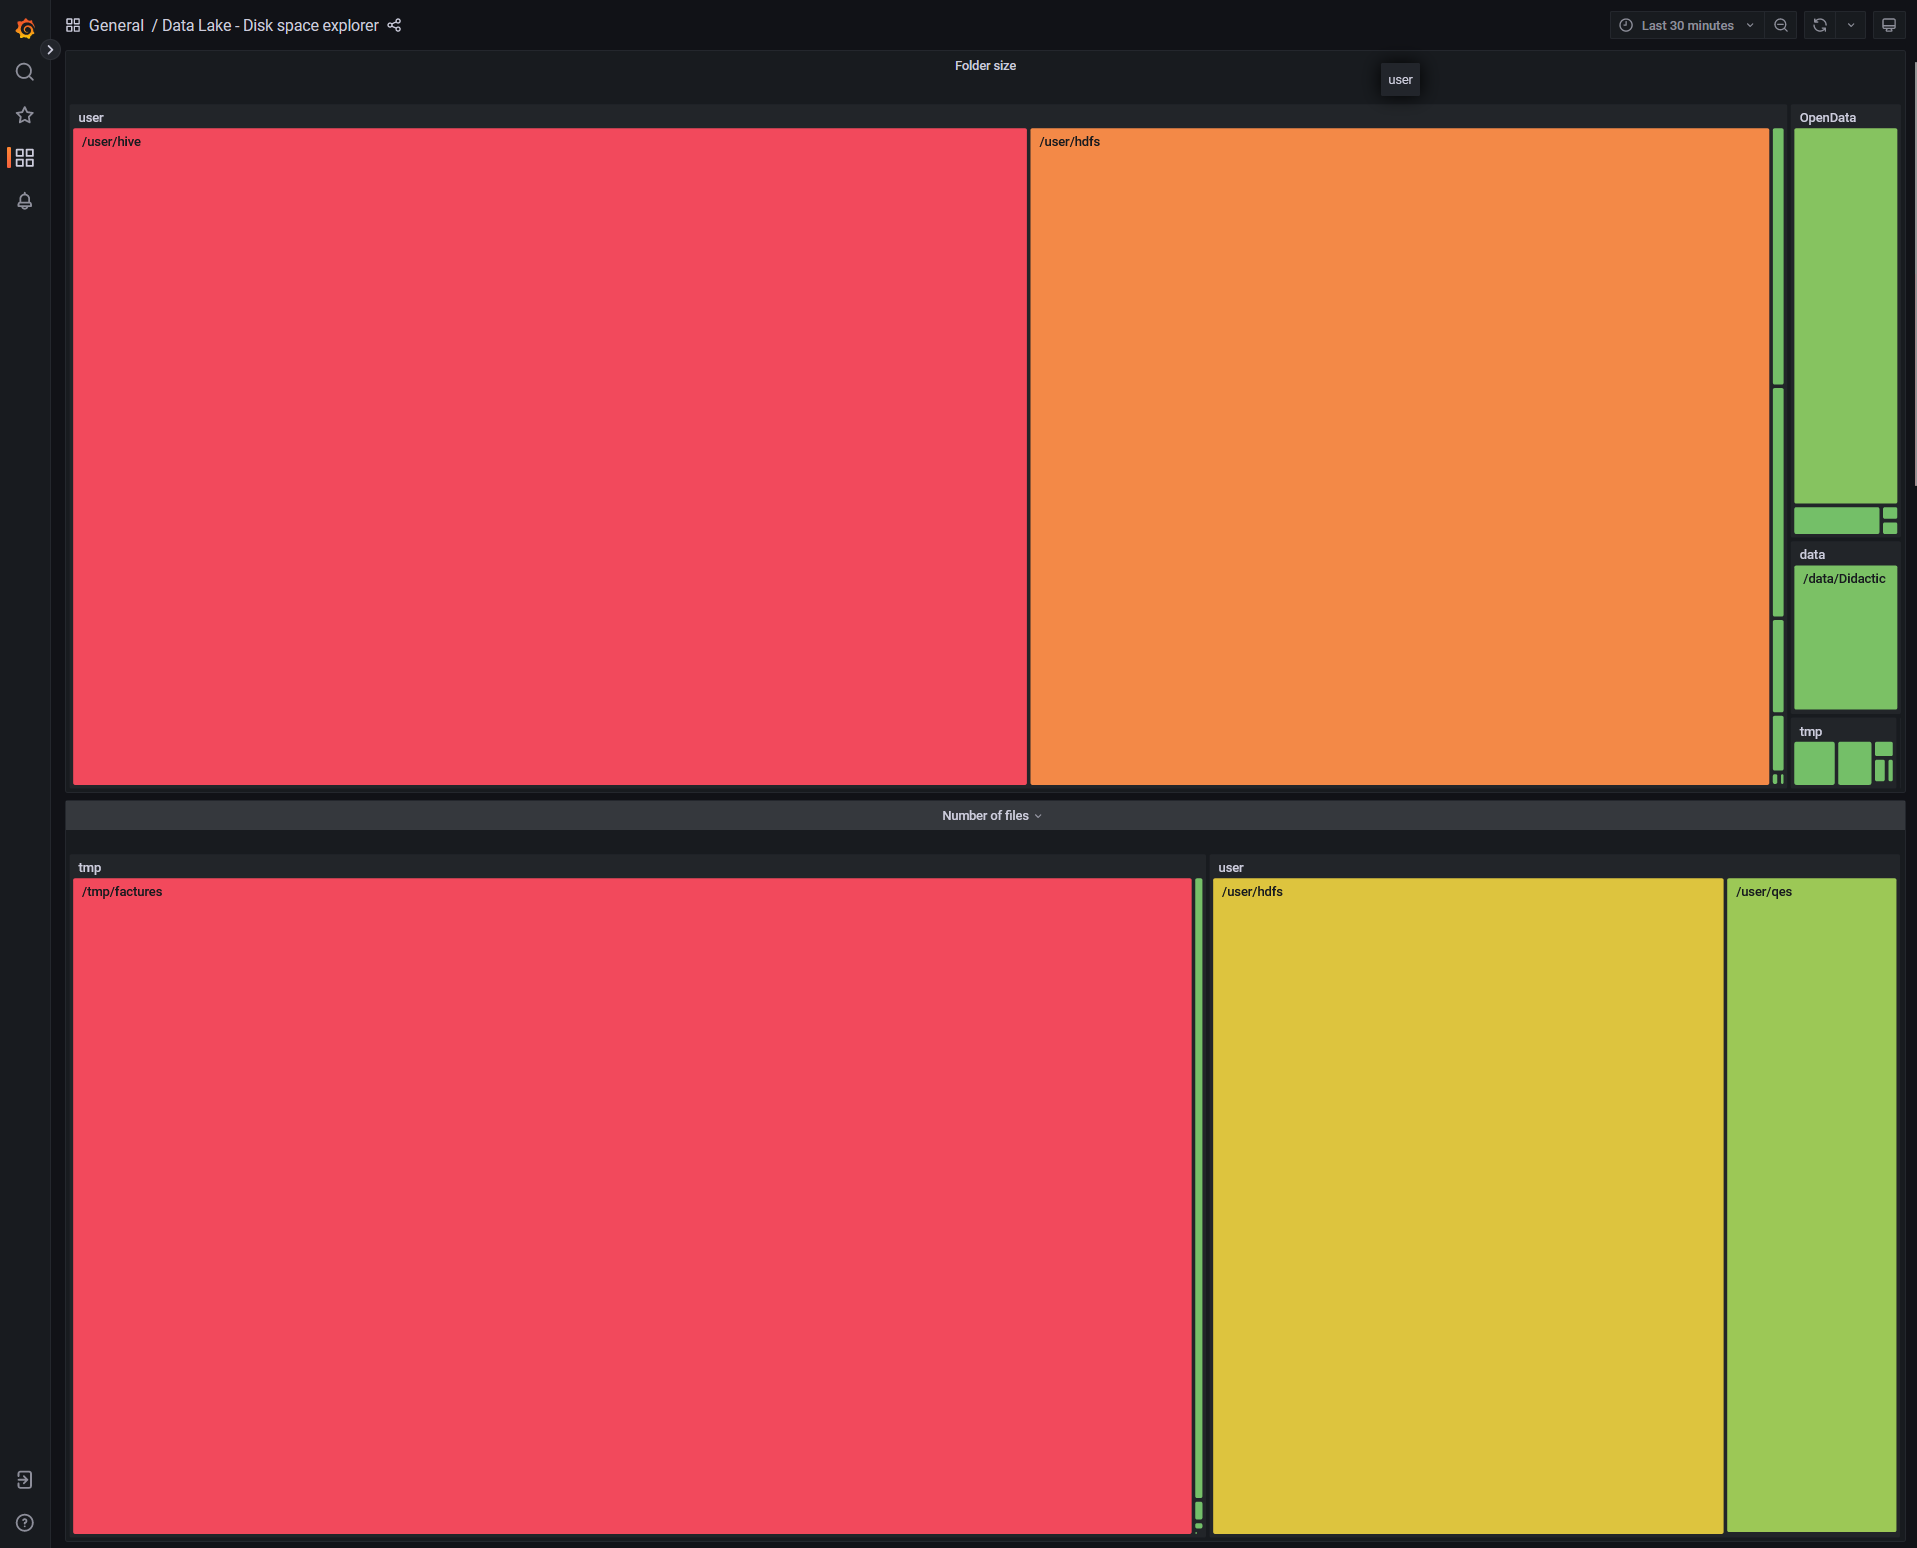
You can see information about the size of first level directories in the Folder size dashboard, and about the number of files per first level directories in the Number of files dashboard.
|
Hover over an element in the graphs to display a tooltip with more details. |
Data Lake - Global Usage
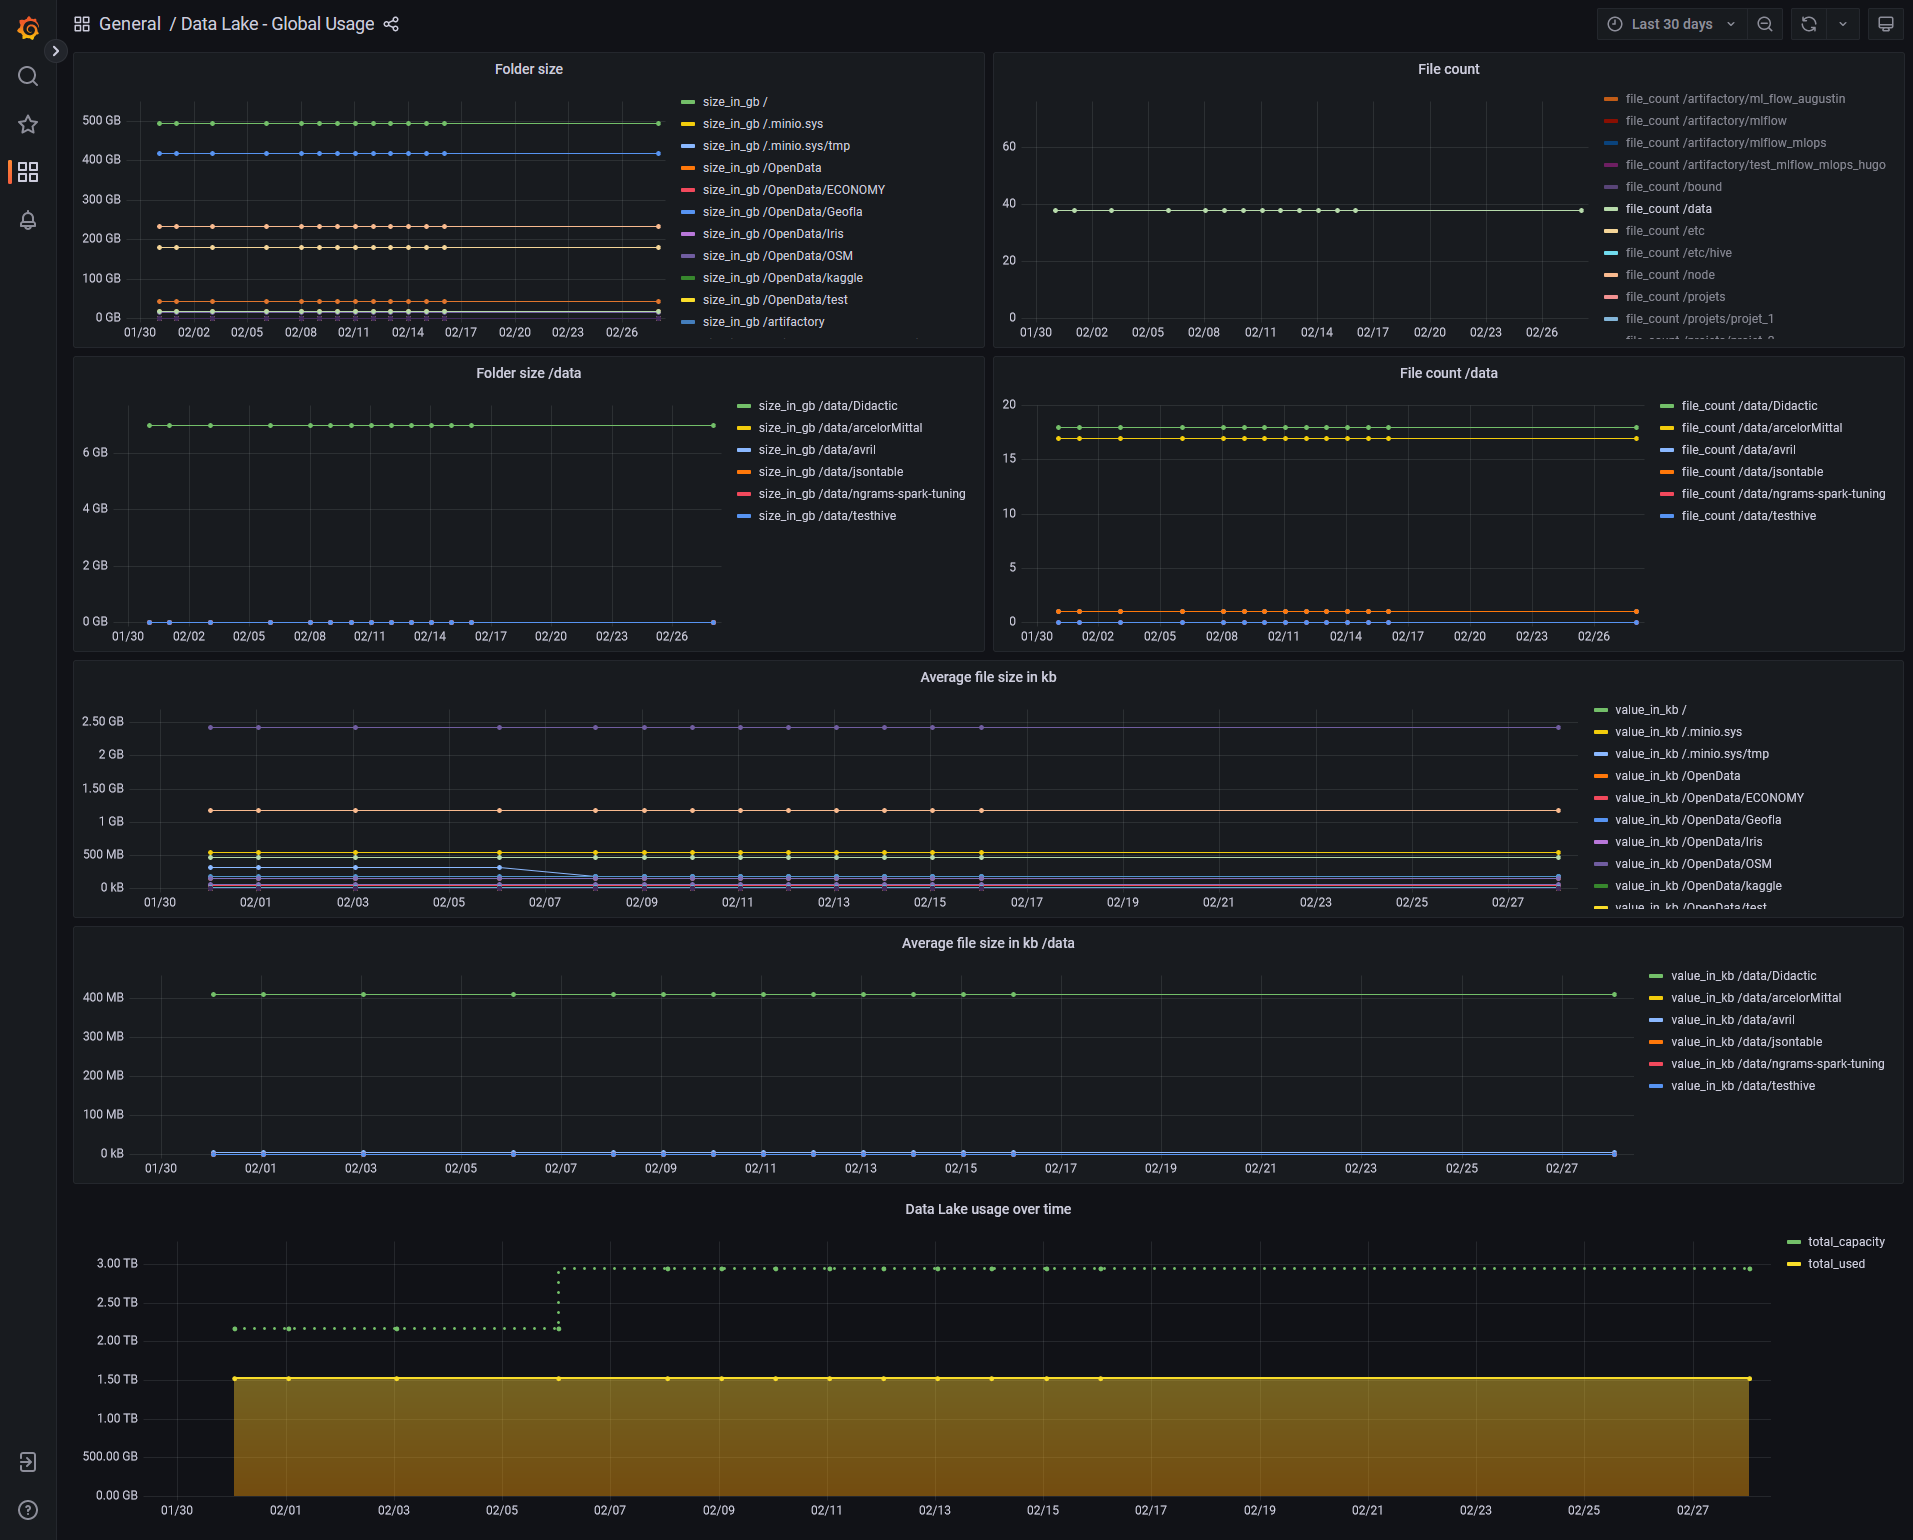
This page allows you to see the history of the size of the directories, and the number of files. You can also see information about the average file size, and the storage space used compared to the overall capacity.
-
Grafana documentation: Use dashboards