About the Monitoring Module
Cluster Overview Page
The ![]() Overview page of your cluster provides information about the resource consumption of all your platforms.
Overview page of your cluster provides information about the resource consumption of all your platforms.
By default, the Cluster Overview page opens when you click the ![]() Monitoring module.
Monitoring module.
The page gives you an overview of your cluster’s node consumption and reservation. It is composed of a two-column table describing the consumption of ![]() CPU and
CPU and ![]() RAM resources.
RAM resources.
This is the entry point for monitoring the overall capacity of your cluster and the health status of its nodes. Based on these information, you can adjust the limits and requests accordingly for each platform.
|
To have proper access to monitoring details, your administrator must have configured Saagie to isolate the workload between platforms. This is done by specializing your nodes per platform.
If workload isolation has not been configured, the |
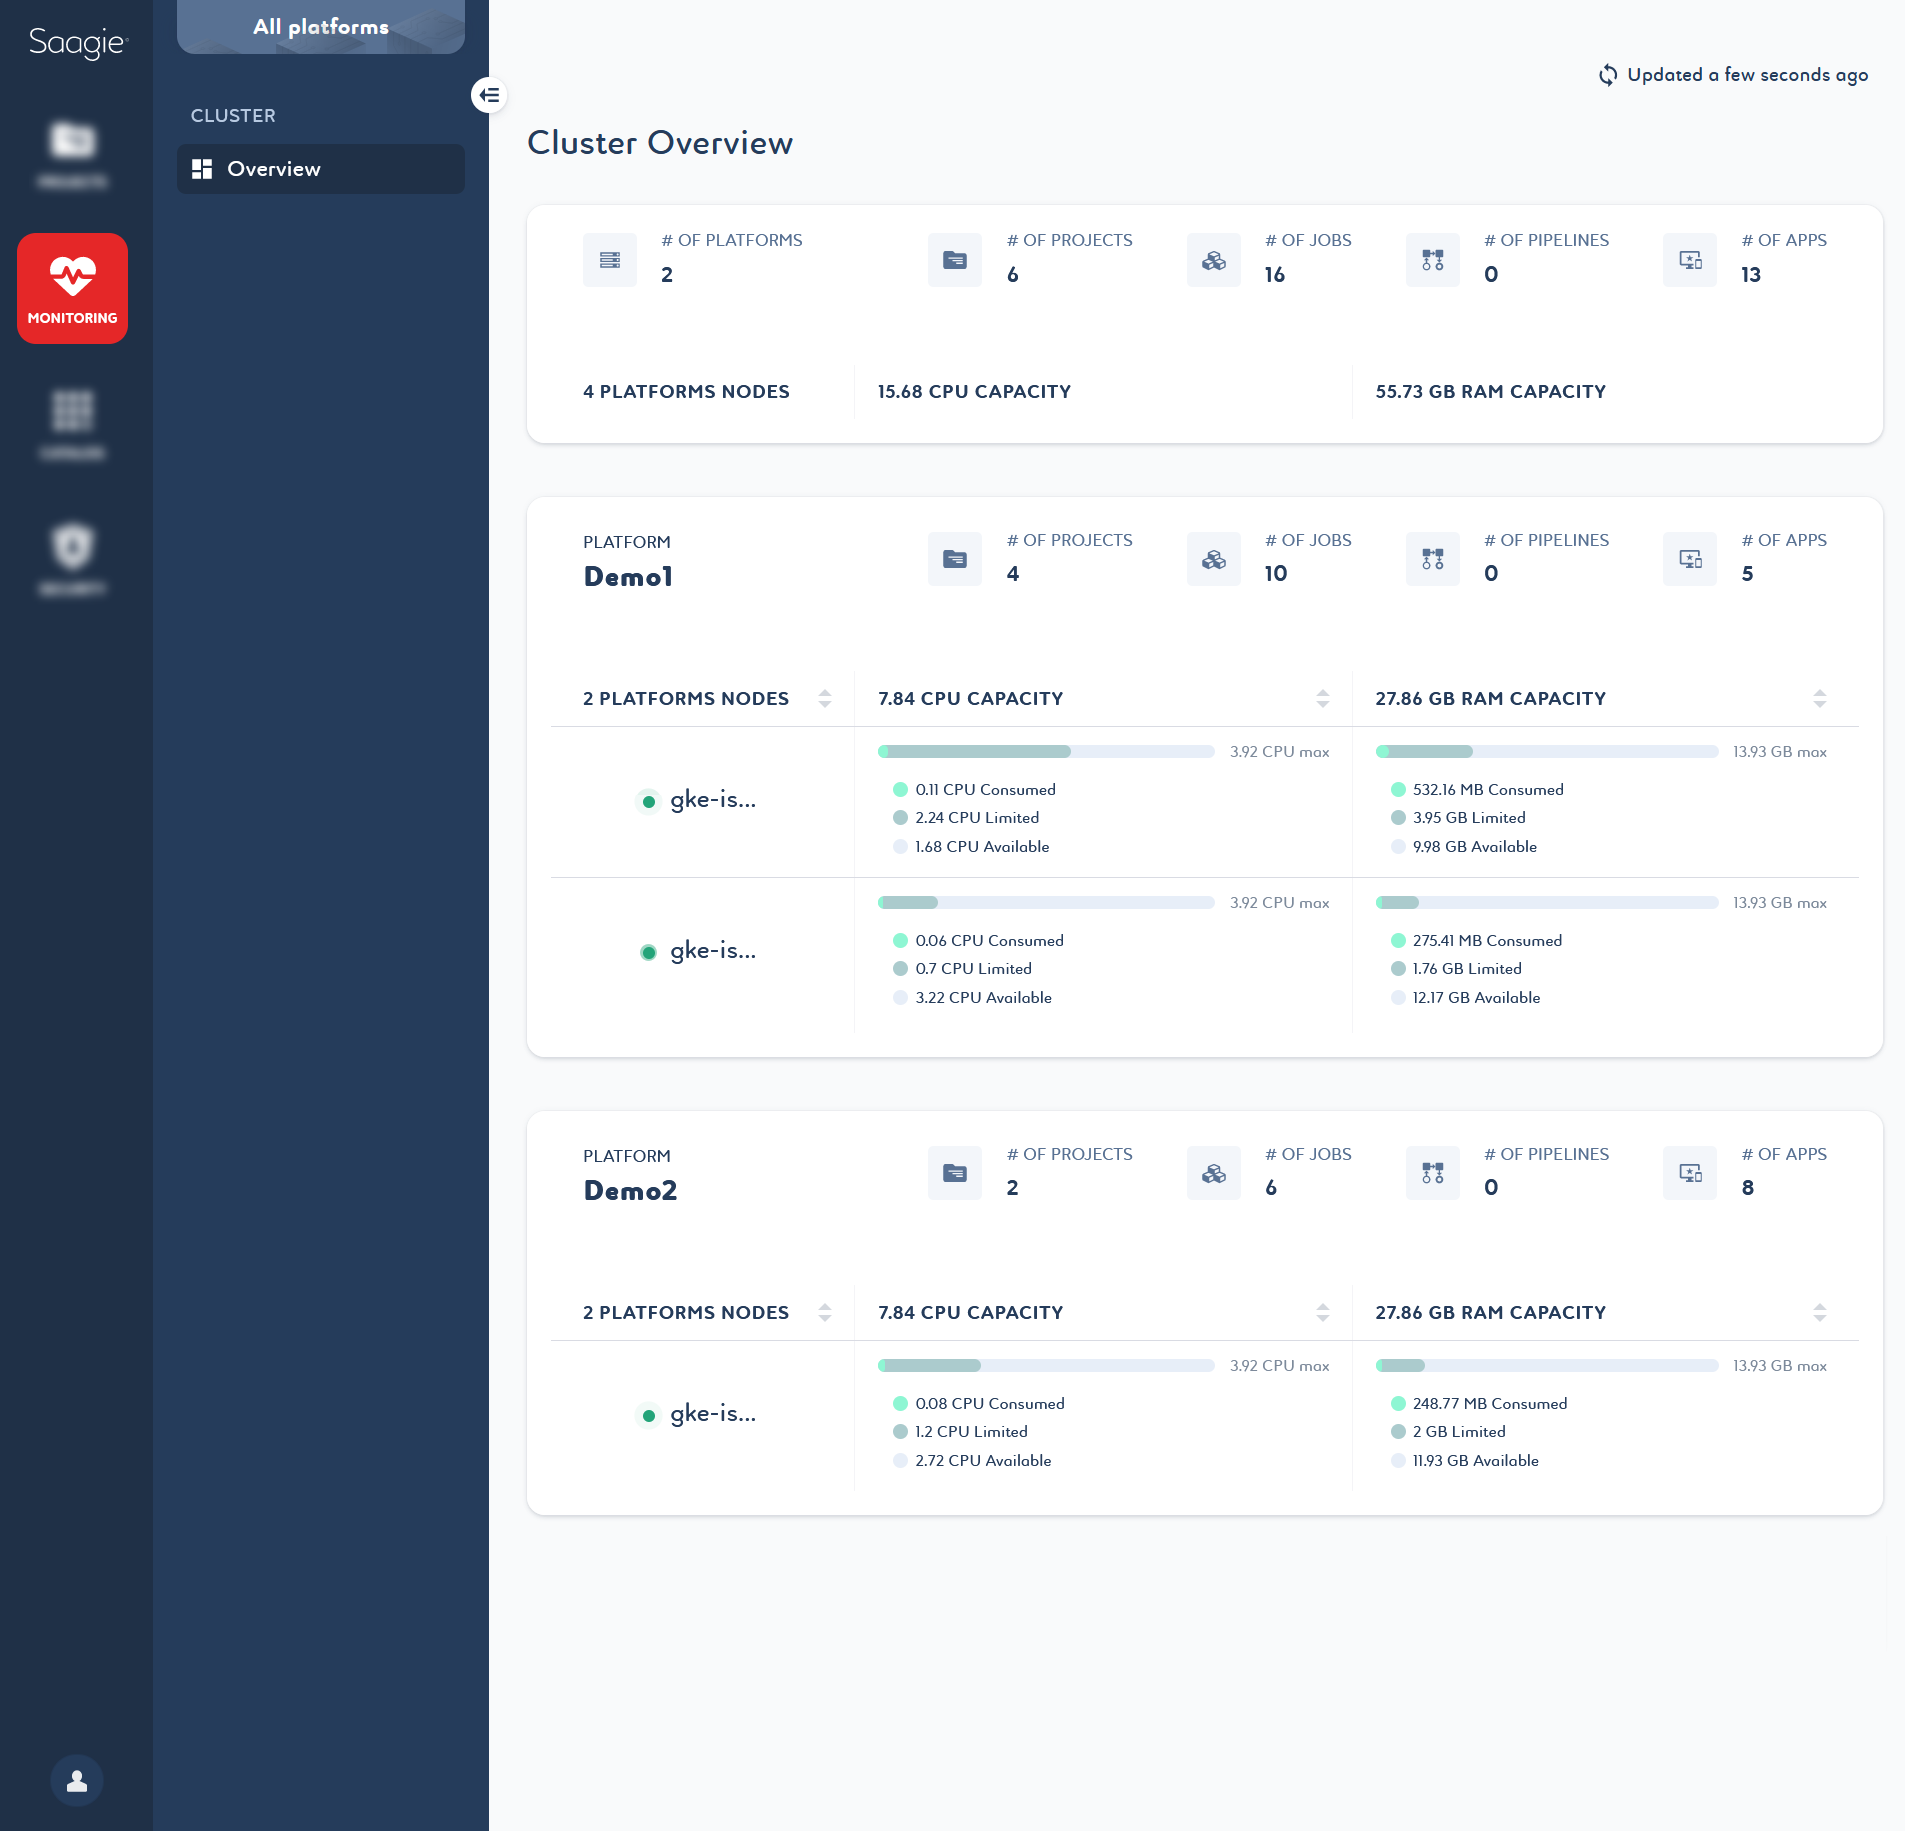
Here is the example of Saagie installed with two platforms. One installation with your isolated workload and the other without.
If you have four nodes in your cluster, the ![]() Cluster Overview page will show your platforms with their dedicated node(s) only. If a node is not labeled, it will not be considered for Saagie runs and will not appear.
Cluster Overview page will show your platforms with their dedicated node(s) only. If a node is not labeled, it will not be considered for Saagie runs and will not appear.
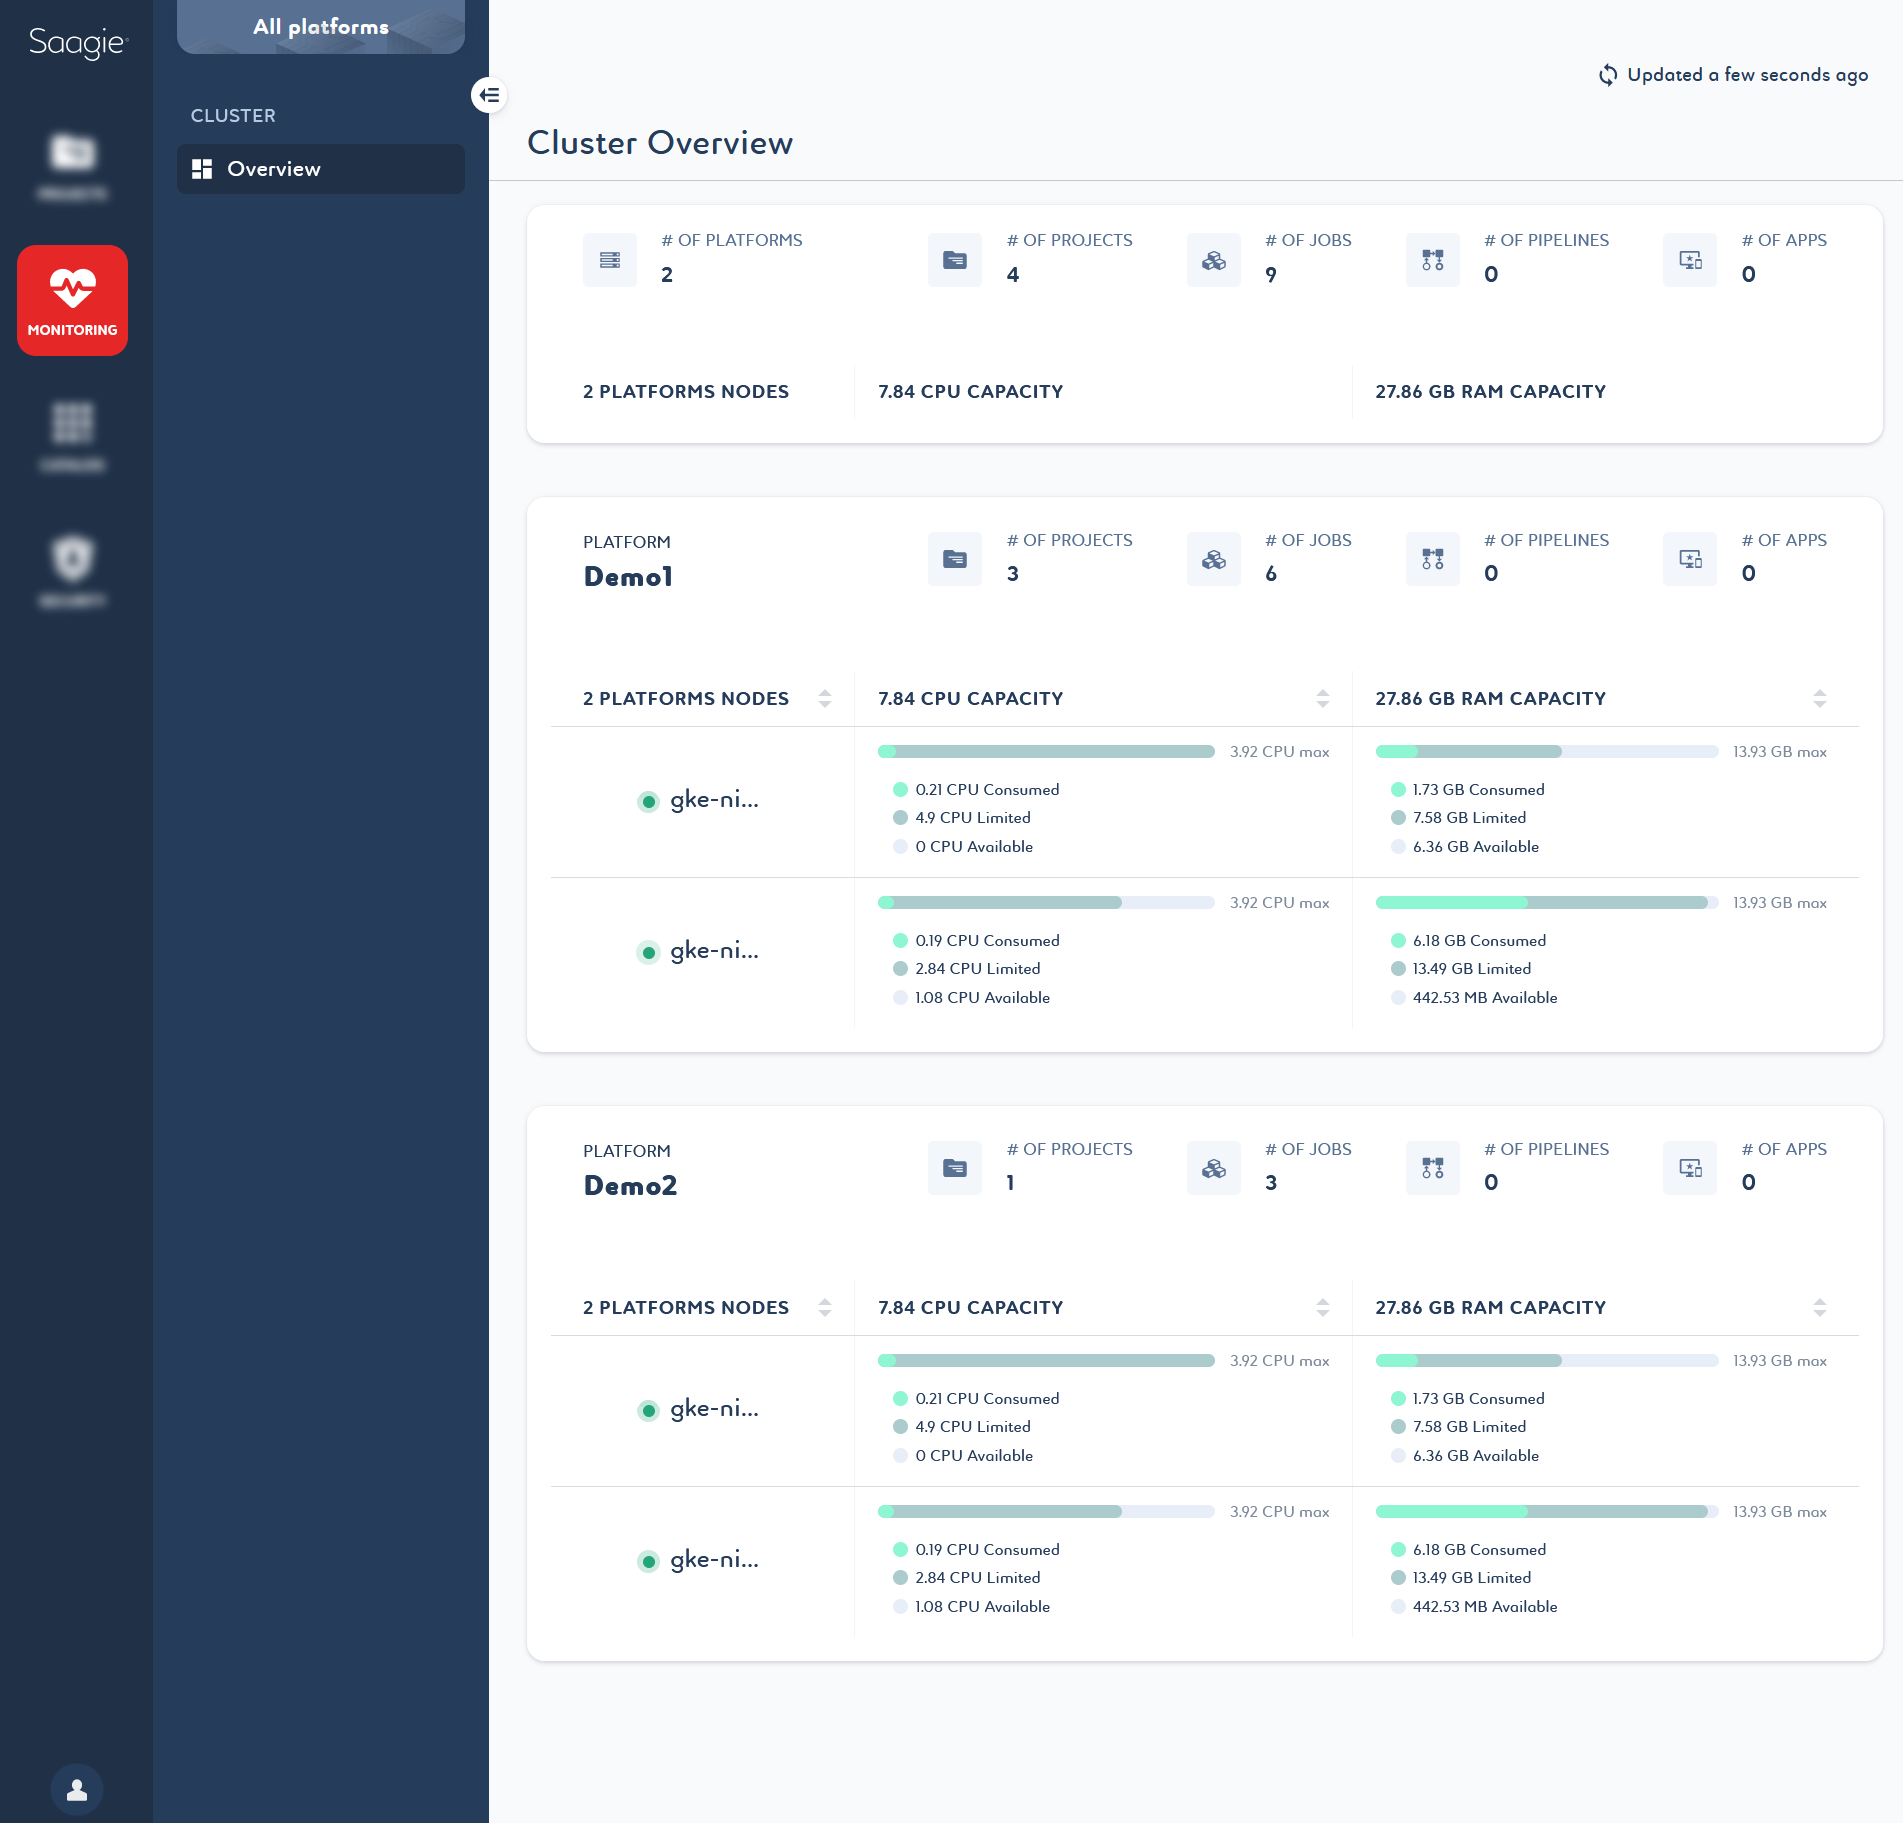
If you have four nodes in your cluster, the ![]() Cluster Overview page will show all the cluster nodes on each of your platforms without dissociation, even if no resources are used on those nodes by your platform.
Cluster Overview page will show all the cluster nodes on each of your platforms without dissociation, even if no resources are used on those nodes by your platform.
App, Job, and Pipeline Resource Consumption Graphs
The ![]() Overview and
Overview and ![]() Instances pages for apps, jobs, and pipelines also include graphs that allow you to track consumption as the job, app, or pipeline runs on the node. It can help you quickly identify bottlenecks, debug jobs and apps going
Instances pages for apps, jobs, and pipelines also include graphs that allow you to track consumption as the job, app, or pipeline runs on the node. It can help you quickly identify bottlenecks, debug jobs and apps going ![]() Out Of Memory, and better optimize resource usage on your platform.
Out Of Memory, and better optimize resource usage on your platform.
You can click the graph line to display tooltips with more information, and you can zoom in on a specific period.
Resource Details Page
The ![]() Resource Details page is an external link that will take you to the Saagie Resources Monitoring (SRM) page. SRM gives you an overview of your cluster’s resource consumption through a series of graphs.
Resource Details page is an external link that will take you to the Saagie Resources Monitoring (SRM) page. SRM gives you an overview of your cluster’s resource consumption through a series of graphs.
SRM is based on Grafana. It is a set of graphs providing a global view of RAM and CPU consumption for nodes, jobs, and apps of your cluster.
For more information, see About Saagie Resources Monitoring.